Publication, Part of NCARDRS Congenital Anomaly Statistics: Annual Data
NCARDRS Congenital Condition Official Statistics Report, 2022
Official statistics
Minor change in title
The name of this collection of official statistics has been changed to NCARDRS Congenital Condition Statistics Report
17 October 2025 16:08 PM
Birth prevalence by major condition subgroups
As congenital conditions are a large and diverse group of conditions, they are grouped into internationally standardised condition subgroups (EUROCAT) for reporting. These are broadly defined by the location in the body. Some modifications to these subgroups have been applied and these are described further in the accompanying Technical details and the Condition subgroup inclusion ICD-10 list.
Total and live birth prevalence for 115 groups and individual conditions are presented in Data table 1. Not every condition has been categorised into a group or subgroup in this data table, although most will be included in one of 12 major condition subgroups.
Babies with a condition in more than one group will appear in each row in Data table 1. More than a third (5,452; 36.9%) of babies diagnosed with congenital conditions had more than one condition in 2022, compared with 36.1% (5,089) in 2021.
Prevalence by major condition subgroups
To facilitate reporting, most congenital conditions are grouped into one of 12 major congenital condition subgroups.
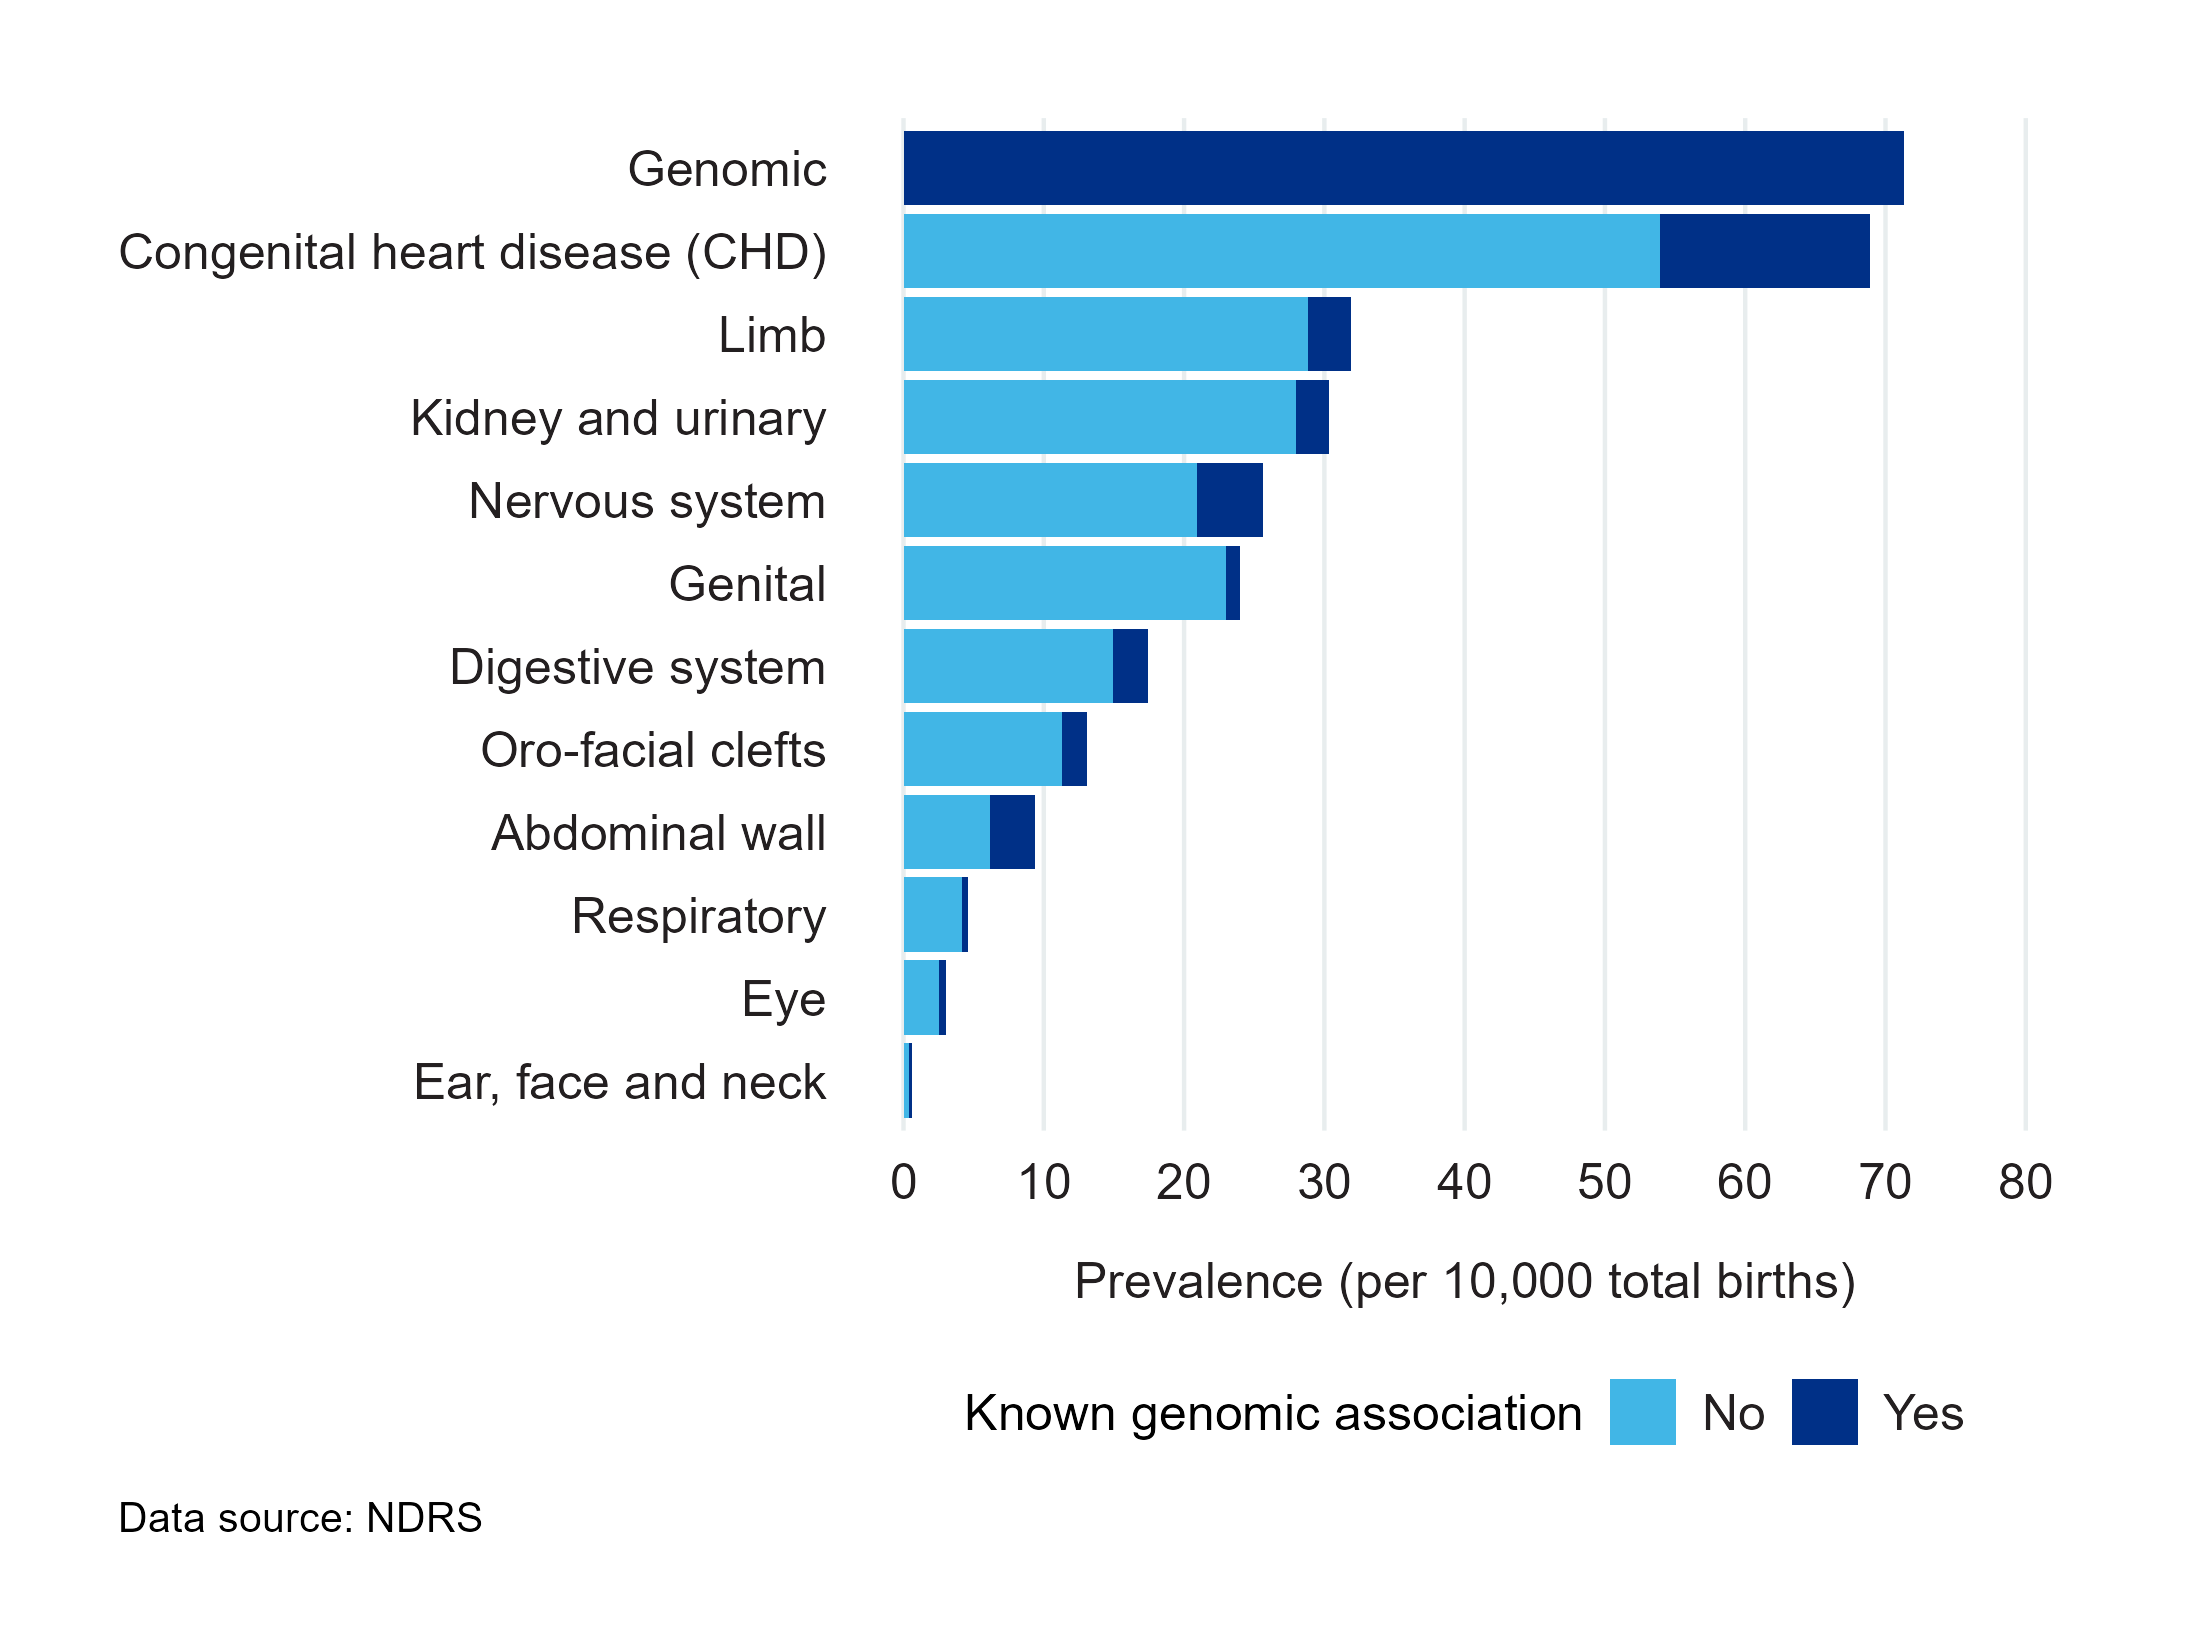
Figures 1a and 1b (Data table 1) show the prevalence, categorised by those with an identified genomic condition (dark blue) and those with no known genomic condition (light blue) in England for:
a) all babies (total birth prevalence)
b) those that were born alive (live birth prevalence).
In these figures, as in Data tables 1, 2a and 2b, babies with multiple conditions are counted in each applicable bar on the chart. For example, a baby with congenital heart disease, that also had limb and genomic conditions, would be represented in each of the three different bars, and in dark blue (genomic) in the bars of the respective structural condition (congenital heart disease and limb).
As well as congenital condition subgroups, conditions are categorised as “genomic” or those that do not have a known genomic association, “non-genomic”. Genomic includes those babies with an identified chromosomal condition, skeletal dysplasia, congenital skin condition or other genomic conditions. In previous reports the term “genetic” was used; in this report we use “genomic” to reflect updated terminology.
The number and proportion of conditions with a known genomic diagnosis (dark blue in the bar chart) are likely to be underestimates as these conditions require genomic testing to be offered, accepted and then to deliver a diagnostic result. Additionally, there are known gaps in our dataflows from the NHS Genomic Laboratory Hubs (GLHs). Whilst we have national coverage for traditional cytogenetic testing, data from next generation sequencing (NGS) based tests, including whole genome sequencing, are not yet comprehensive. We continue to work with partners to improve these data flows and incorporate them as they become available.
Conditions with no known genetic association (light blue in the bar chart) are structural conditions in babies with no identified genomic condition. This includes babies where a genomic result was negative, or where testing was not offered or did not take place. It is important to note that not all babies undergo genomic testing, and it is inevitable that some of the conditions in this category will actually have an underlying genomic aetiology that has not yet been identified or reported to NCARDRS. These figures are therefore likely to be overestimates.
Total birth prevalence of major condition subgroups
Figure 1a and Data table 1 show that total birth prevalence in 2022 was highest for genomic conditions (71.3 per 10,000 total births, 95% CI 69.2-73.5), followed by the congenital heart disease (CHD) subgroup (68.9 per 10,000 total births, 95% CI 66.8-71.1), then by limb conditions (31.9 per 10,000 total births, 95% CI 30.4-33.4) and conditions of the kidney and urinary tract (30.3 per 10,000 total births, 95% CI 28.9-31.7).
In 2022, the prevalence of genomic conditions once again exceeded that of cardiac conditions, representing the second consecutive year this has been observed. This likely reflects continued improvements in the ascertainment of genomic laboratory data, alongside growth in the availability, volume and sensitivity of genomic testing, leading to the identification of more babies with conditions with underlying genomic aetiologies.
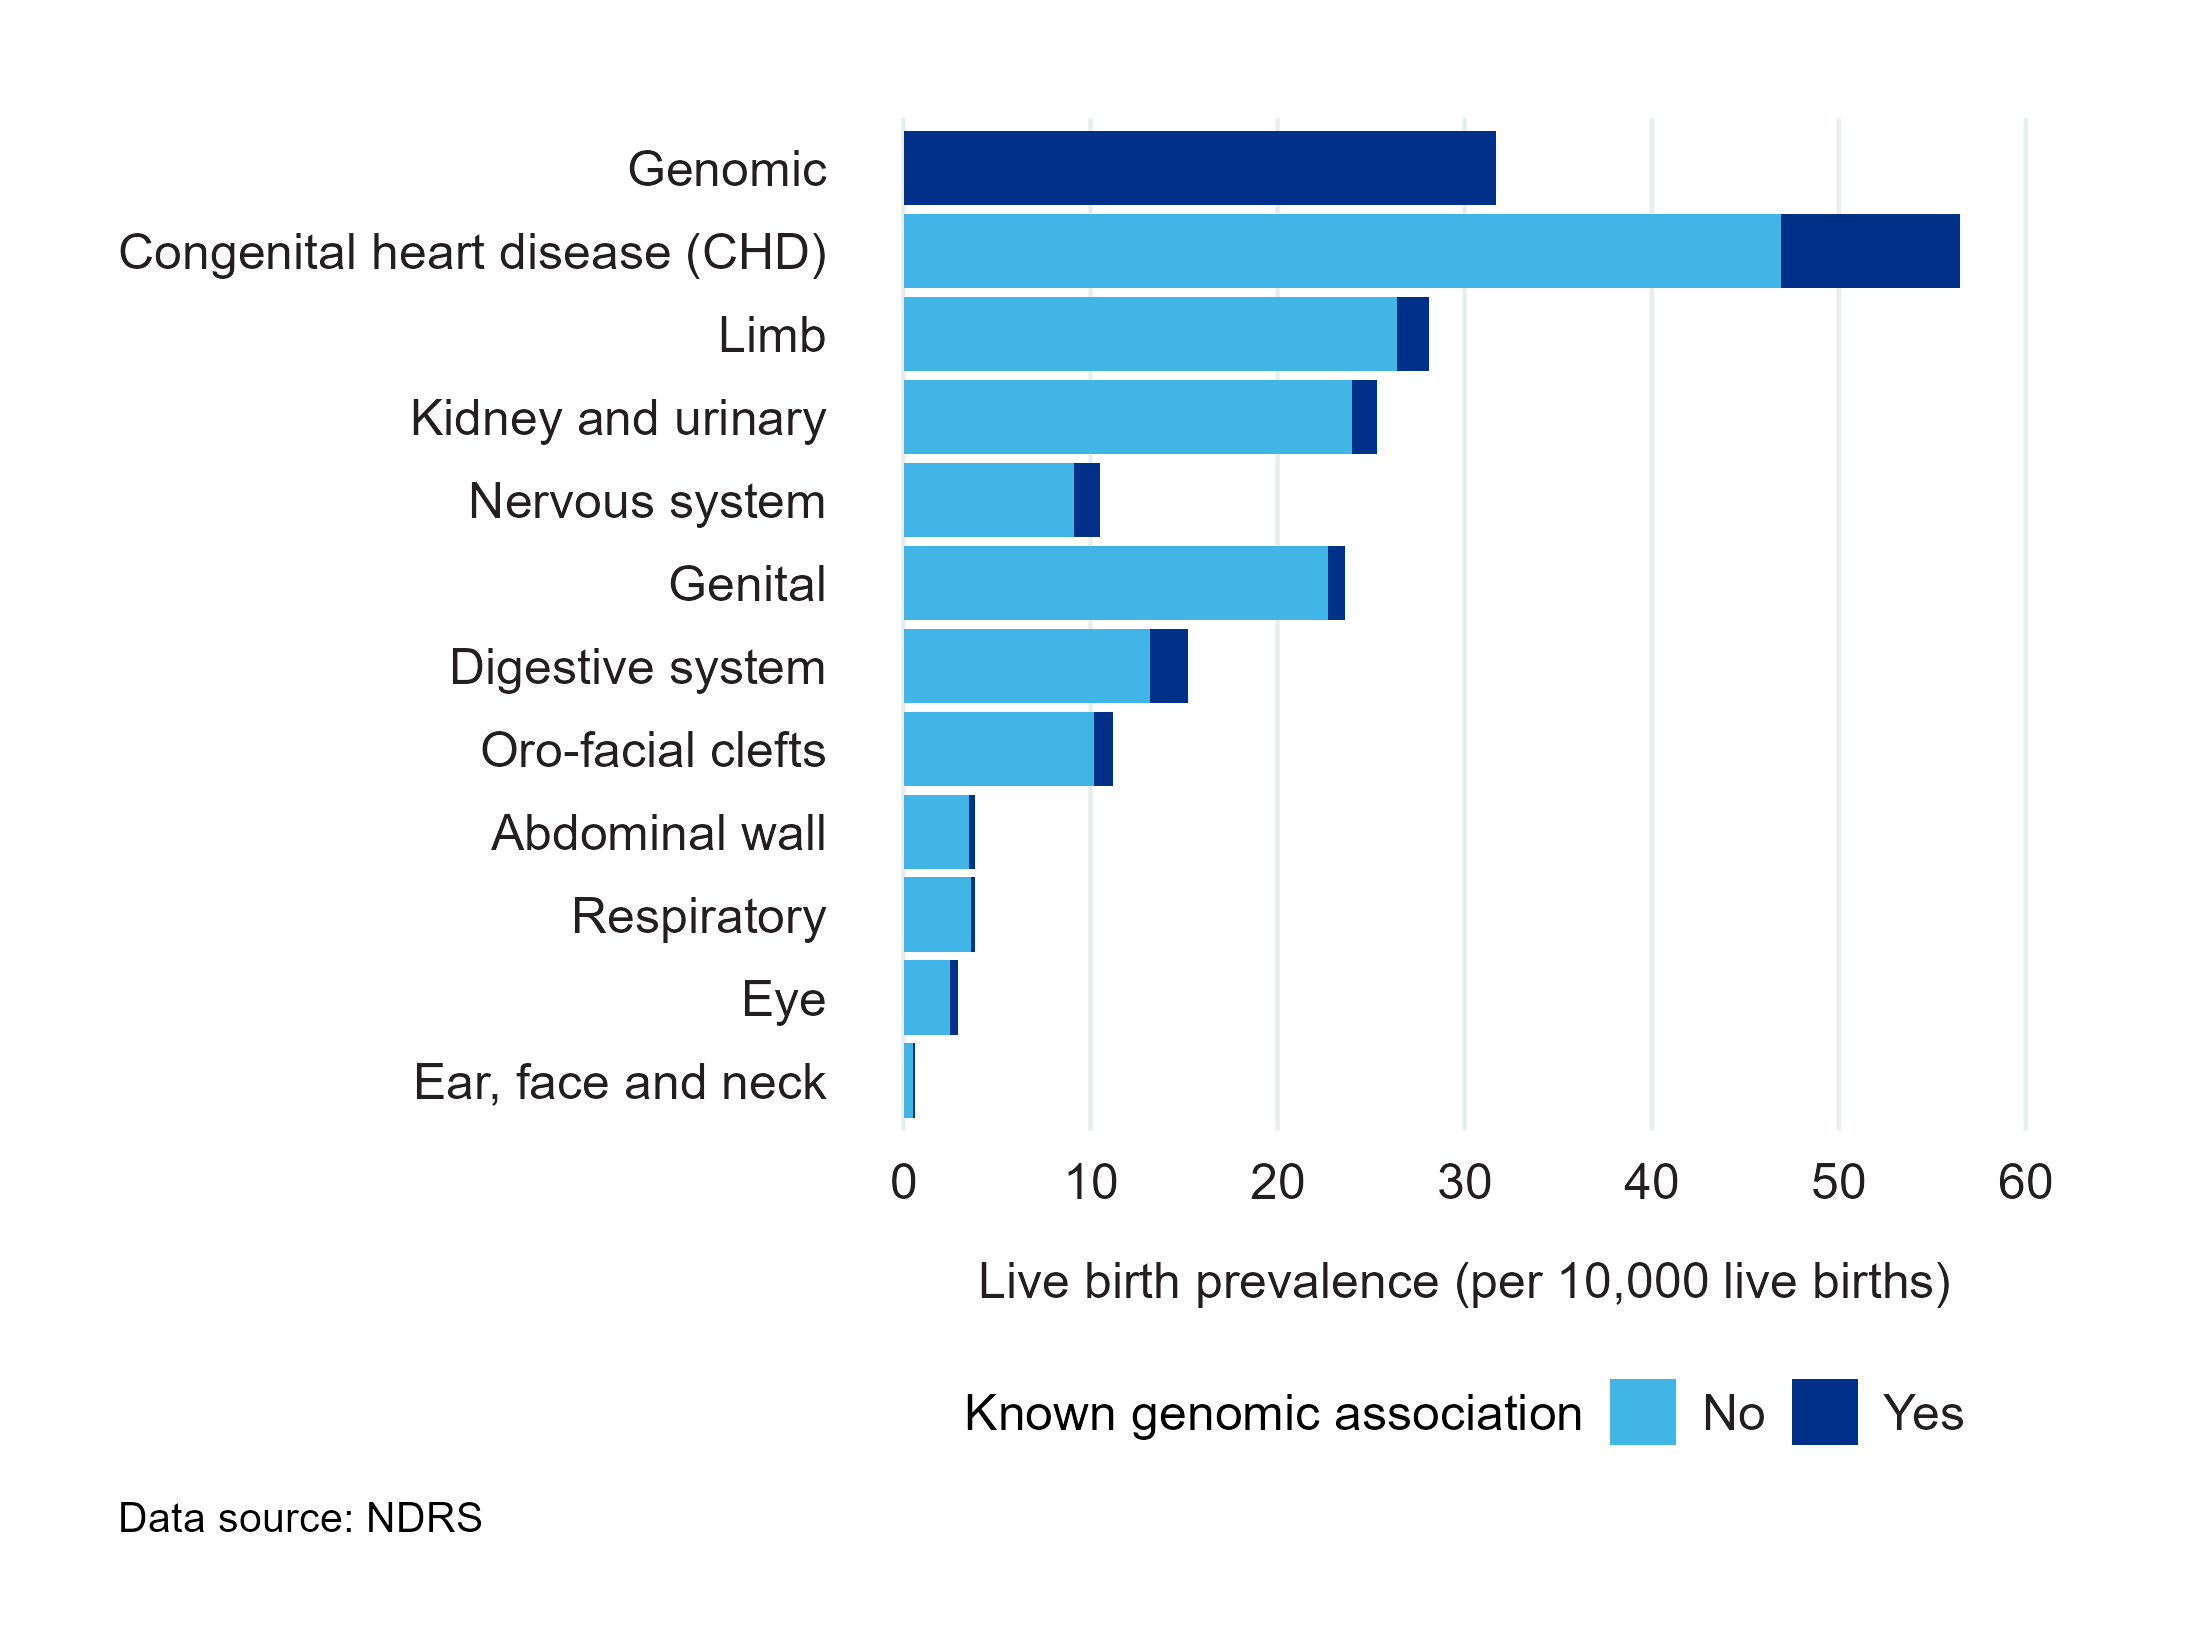
Live birth prevalence by condition group
Figure 1b and Data table 1 show that the prevalence for those who are born alive was highest in CHD conditions (56.5 per 10,000 live births, 95% CI 54.6-58.5), followed by the genomic conditions subgroup (31.7 per 10,000 live births, 95% CI 30.3-33.2), the limb conditions subgroup (28.1 per 10,000 live births, 95% CI 26.7-29.5) and kidneys and urinary tract conditions (25.3 per 10,000 live births, 95% CI 24.0-26.6).
The pattern for all babies diagnosed with a congenital condition, and those that are born alive, is similar for most subgroups apart from genomic and nervous system conditions. The total and live birth prevalence for conditions of the nervous system is, respectively 25.6 per 10,000 total births (95% CI 24.3-26.9) and 10.5 per 10,000 live births (CI 9.7-11.4). The lower live birth prevalence compared to total birth prevalence in these two condition groups reflects the severity of some of the conditions in these subgroups, which rarely result in a live birth.
Last edited: 3 November 2025 11:38 am