Publication, Part of NCARDRS Congenital Anomaly Statistics: Annual Data
NCARDRS Congenital Condition Official Statistics Report, 2022
Official statistics
Minor change in title
The name of this collection of official statistics has been changed to NCARDRS Congenital Condition Statistics Report
17 October 2025 16:08 PM
Total birth prevalence by region
Total birth prevalence of all congenital conditions, by region
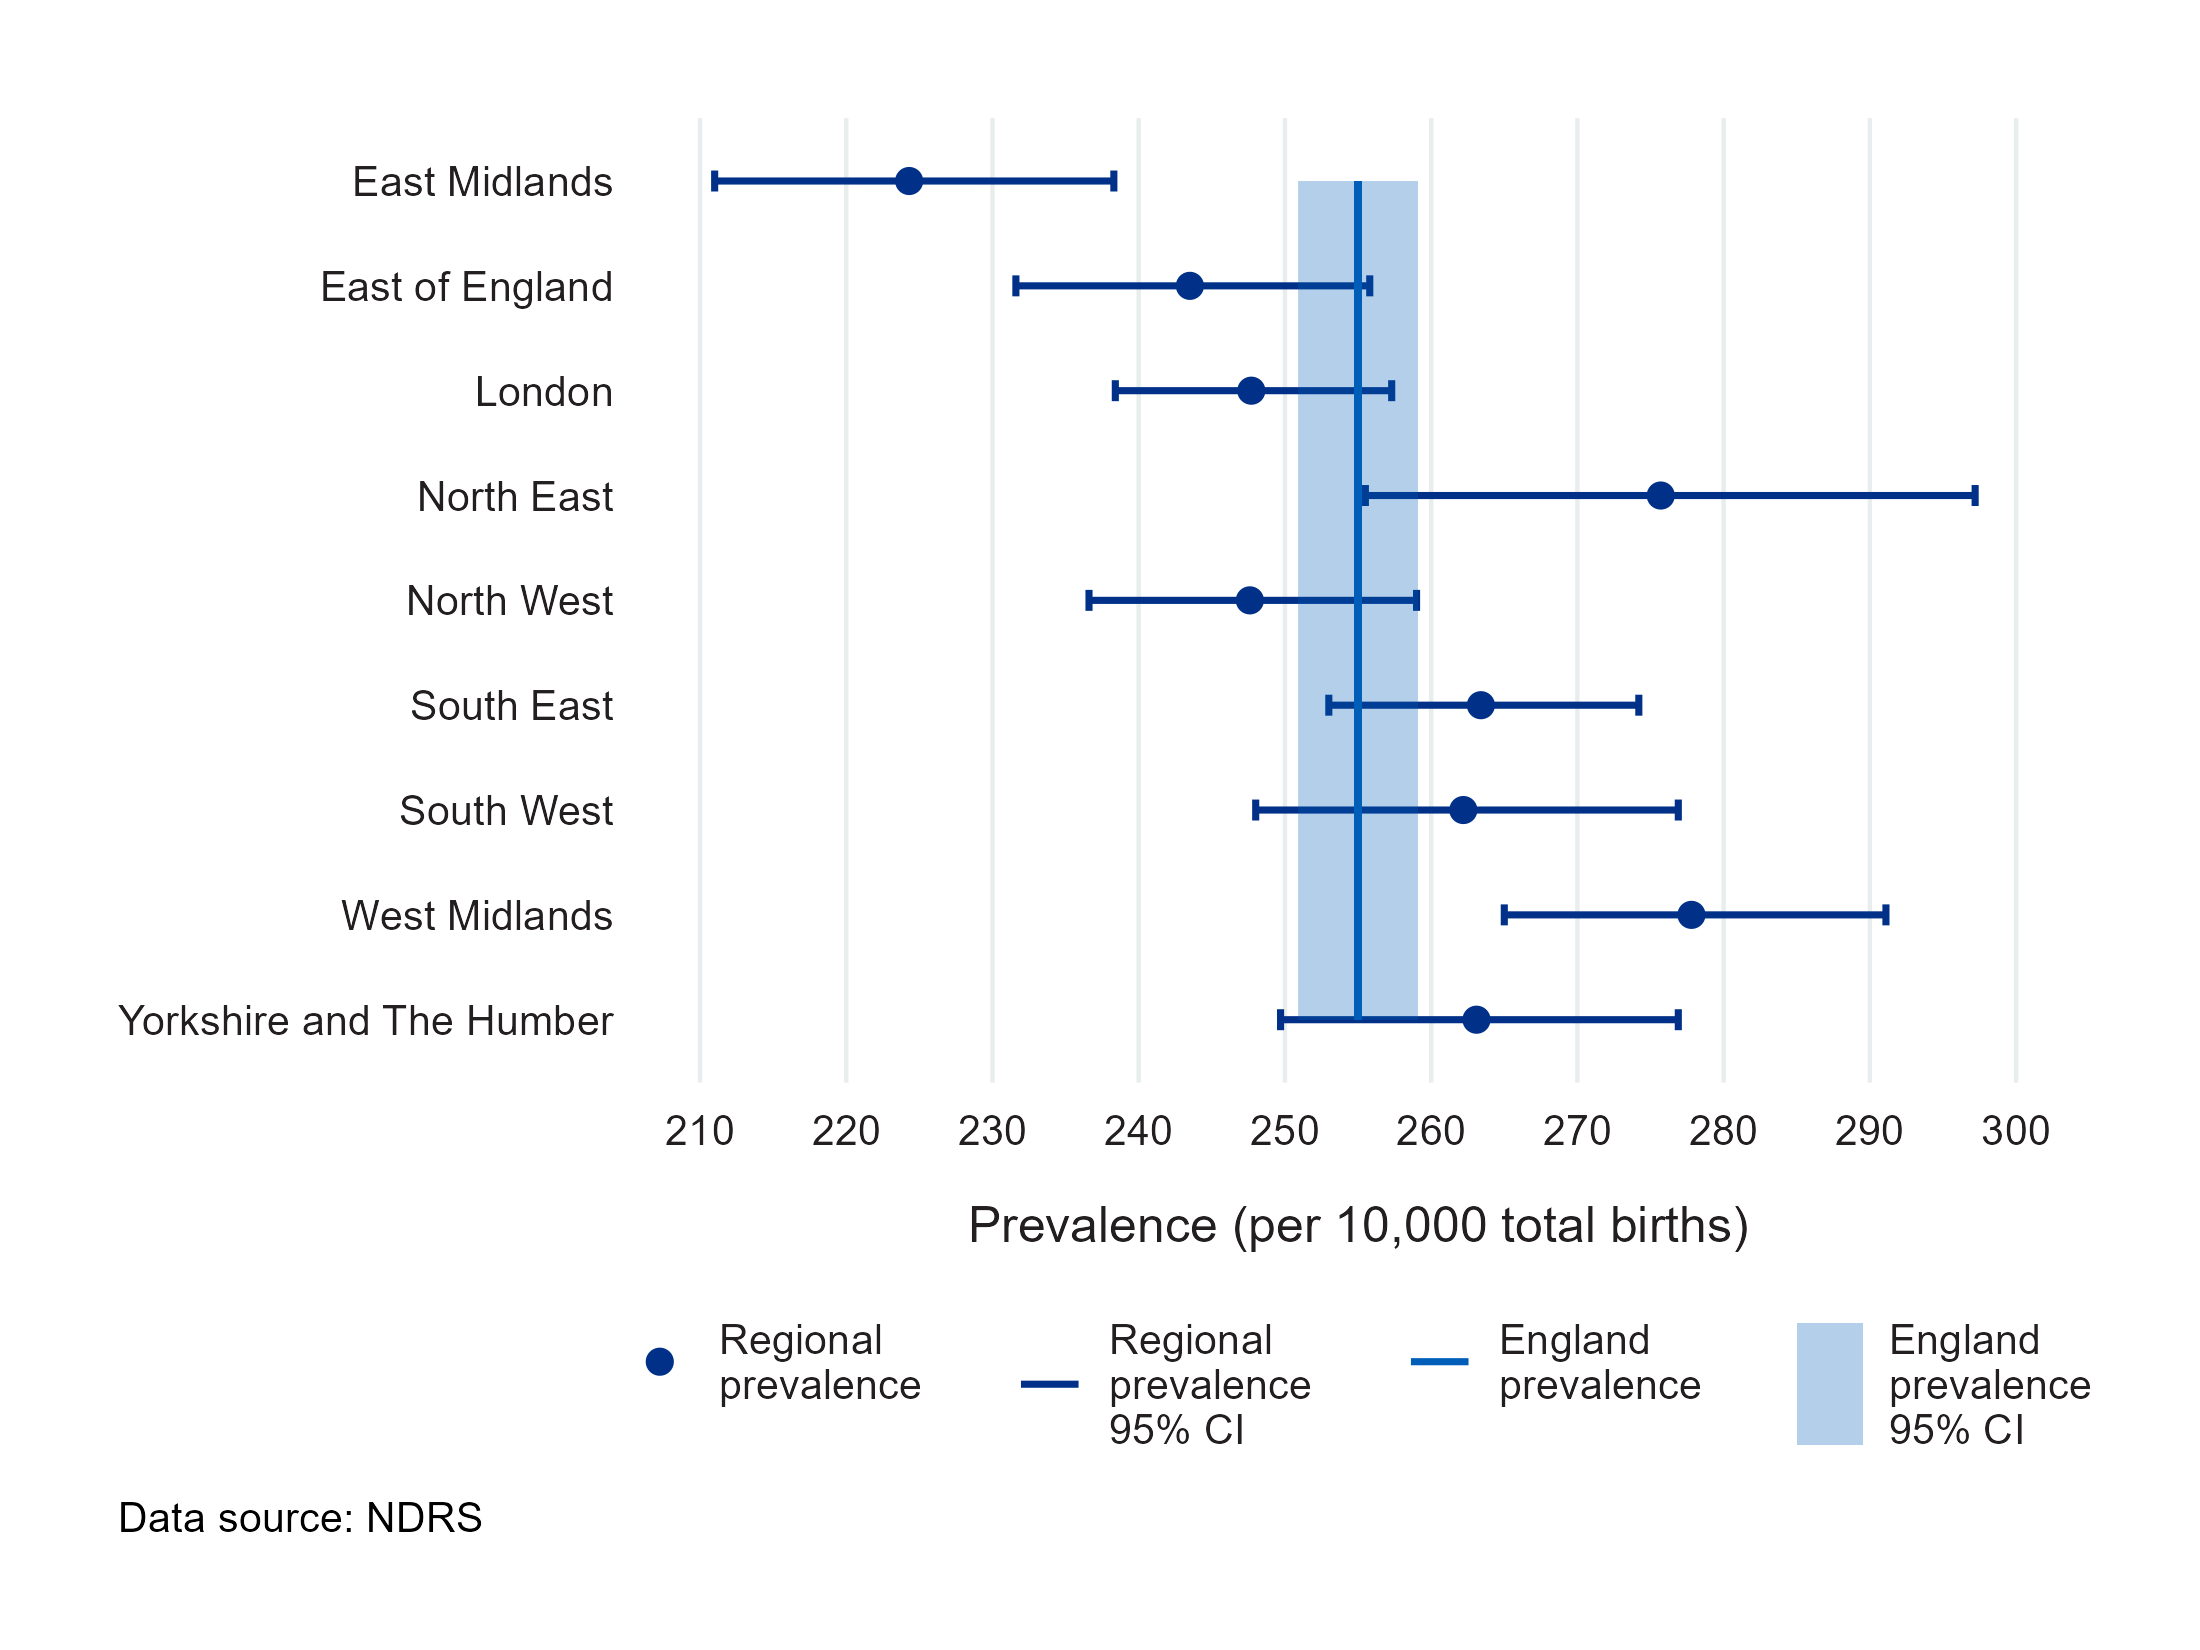
Figure 2a and Data table 2a present total birth prevalence (the number of babies diagnosed with at least one congenital condition per 10,000 total births) in 2022 by Government Office Region (GOR) in England. This data is available at a more granular geography, by Integrated Care Board (ICB), in Data table 2b. A full description of regional geographies and any modifications required for disclosure control purposes is available in the Technical details.
Prevalence per 10,000 total births was highest in the West Midlands region (277.8, 95% CI 265.0-291.1) and lowest in the East Midlands (224.3, 95% CI 211.0-238.3).
As the regional breakdown has changed to be more consistent with other statistical publications, direct comparisons with previous publications are not possible. However, the overall prevalence of congenital conditions in 2022 was more consistent across regions as compared to previous years. Total birth prevalence estimates in all regions, other than the East Midlands which was lower and the West Midlands which was higher, were consistent with the average prevalence in England in 2022.
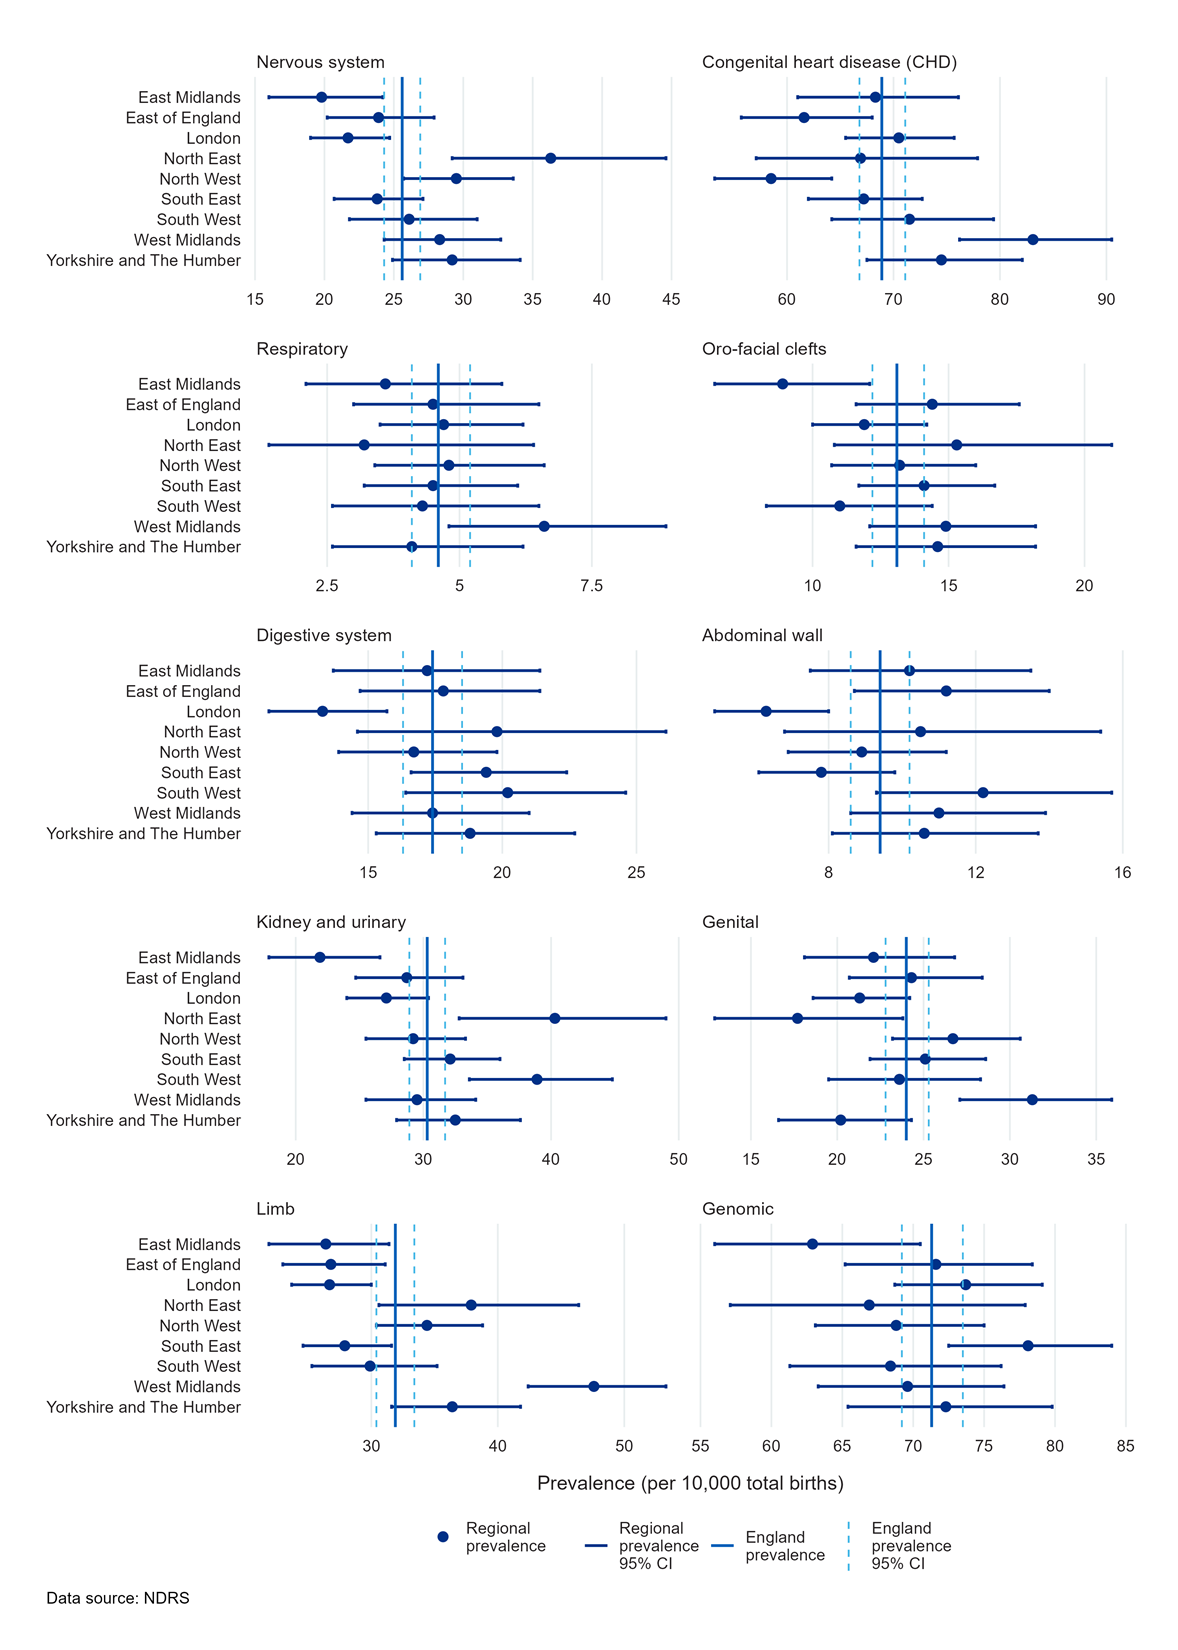
Total birth prevalence of major congenital condition subgroups, by region
Figure 2b and Data table 2a present the counts and prevalence of babies with a condition by region and by major congenital condition subtype. There was relatively little regional variation in genomic, oro-facial cleft and respiratory conditions, but for almost all other subgroups, there were regions where the prevalence was significantly higher or lower than the national average. There was more variation across kidney and urinary and congenital heart disease (CHD) subgroups; CHD was significantly higher in the West Midlands, but significantly lower in the North West. Limb and genital conditions were also significantly higher than average in the West Midlands.
Why are there differences across regions?
Geographical variation in congenital condition birth prevalence may be associated with differences in case ascertainment resulting from different data sources, access to remote data systems and the regional variation in the length of time registration has been established. Improvement in data completeness and ascertainment in certain regions over time may also explain the overall increase in prevalence seen at a national level compared to previous years.
However, there are other reasons which could influence the results presented, such as disease clustering, exposure to teratogens, demographic variation including age at delivery, deprivation profiles between regions and the composition of the local population.
As NCARDRS accumulates more data at a national level over time, and registration in newer regions matures, greater insights will be gained into underlying population characteristics contributing to regional variation, as well as the ability to analyse associations with lifestyle and environmental factors, which may potentially be modifiable.
Birth prevalence (per 10,000 total births) by major condition subgroups and by Integrated Care Board (ICB)
Further geographic granularity is provided in Data table 2b, which presents the prevalence of the 12 major congenital condition subgroups and total prevalence by ICBs in England for 2022.
Please see section 5 of the Technical details for information on how the data has been aggregated according to ICBs and for where ICBs have been merged to mitigate the risk of statistical disclosure arising from small population counts.
Last edited: 3 November 2025 11:38 am