Publication, Part of NCARDRS Congenital Anomaly Statistics: Annual Data
NCARDRS Congenital Condition Official Statistics Report, 2022
Official statistics
Minor change in title
The name of this collection of official statistics has been changed to NCARDRS Congenital Condition Statistics Report
17 October 2025 16:08 PM
Important public health indicators: deprivation
NCARDRS reports on total birth prevalence (per 10,000 total births) of congenital conditions by deprivation using the Index of Multiple Deprivation (IMD).
Congenital condition total birth prevalence was higher in areas of high deprivation overall and for conditions with no identified genomic association.
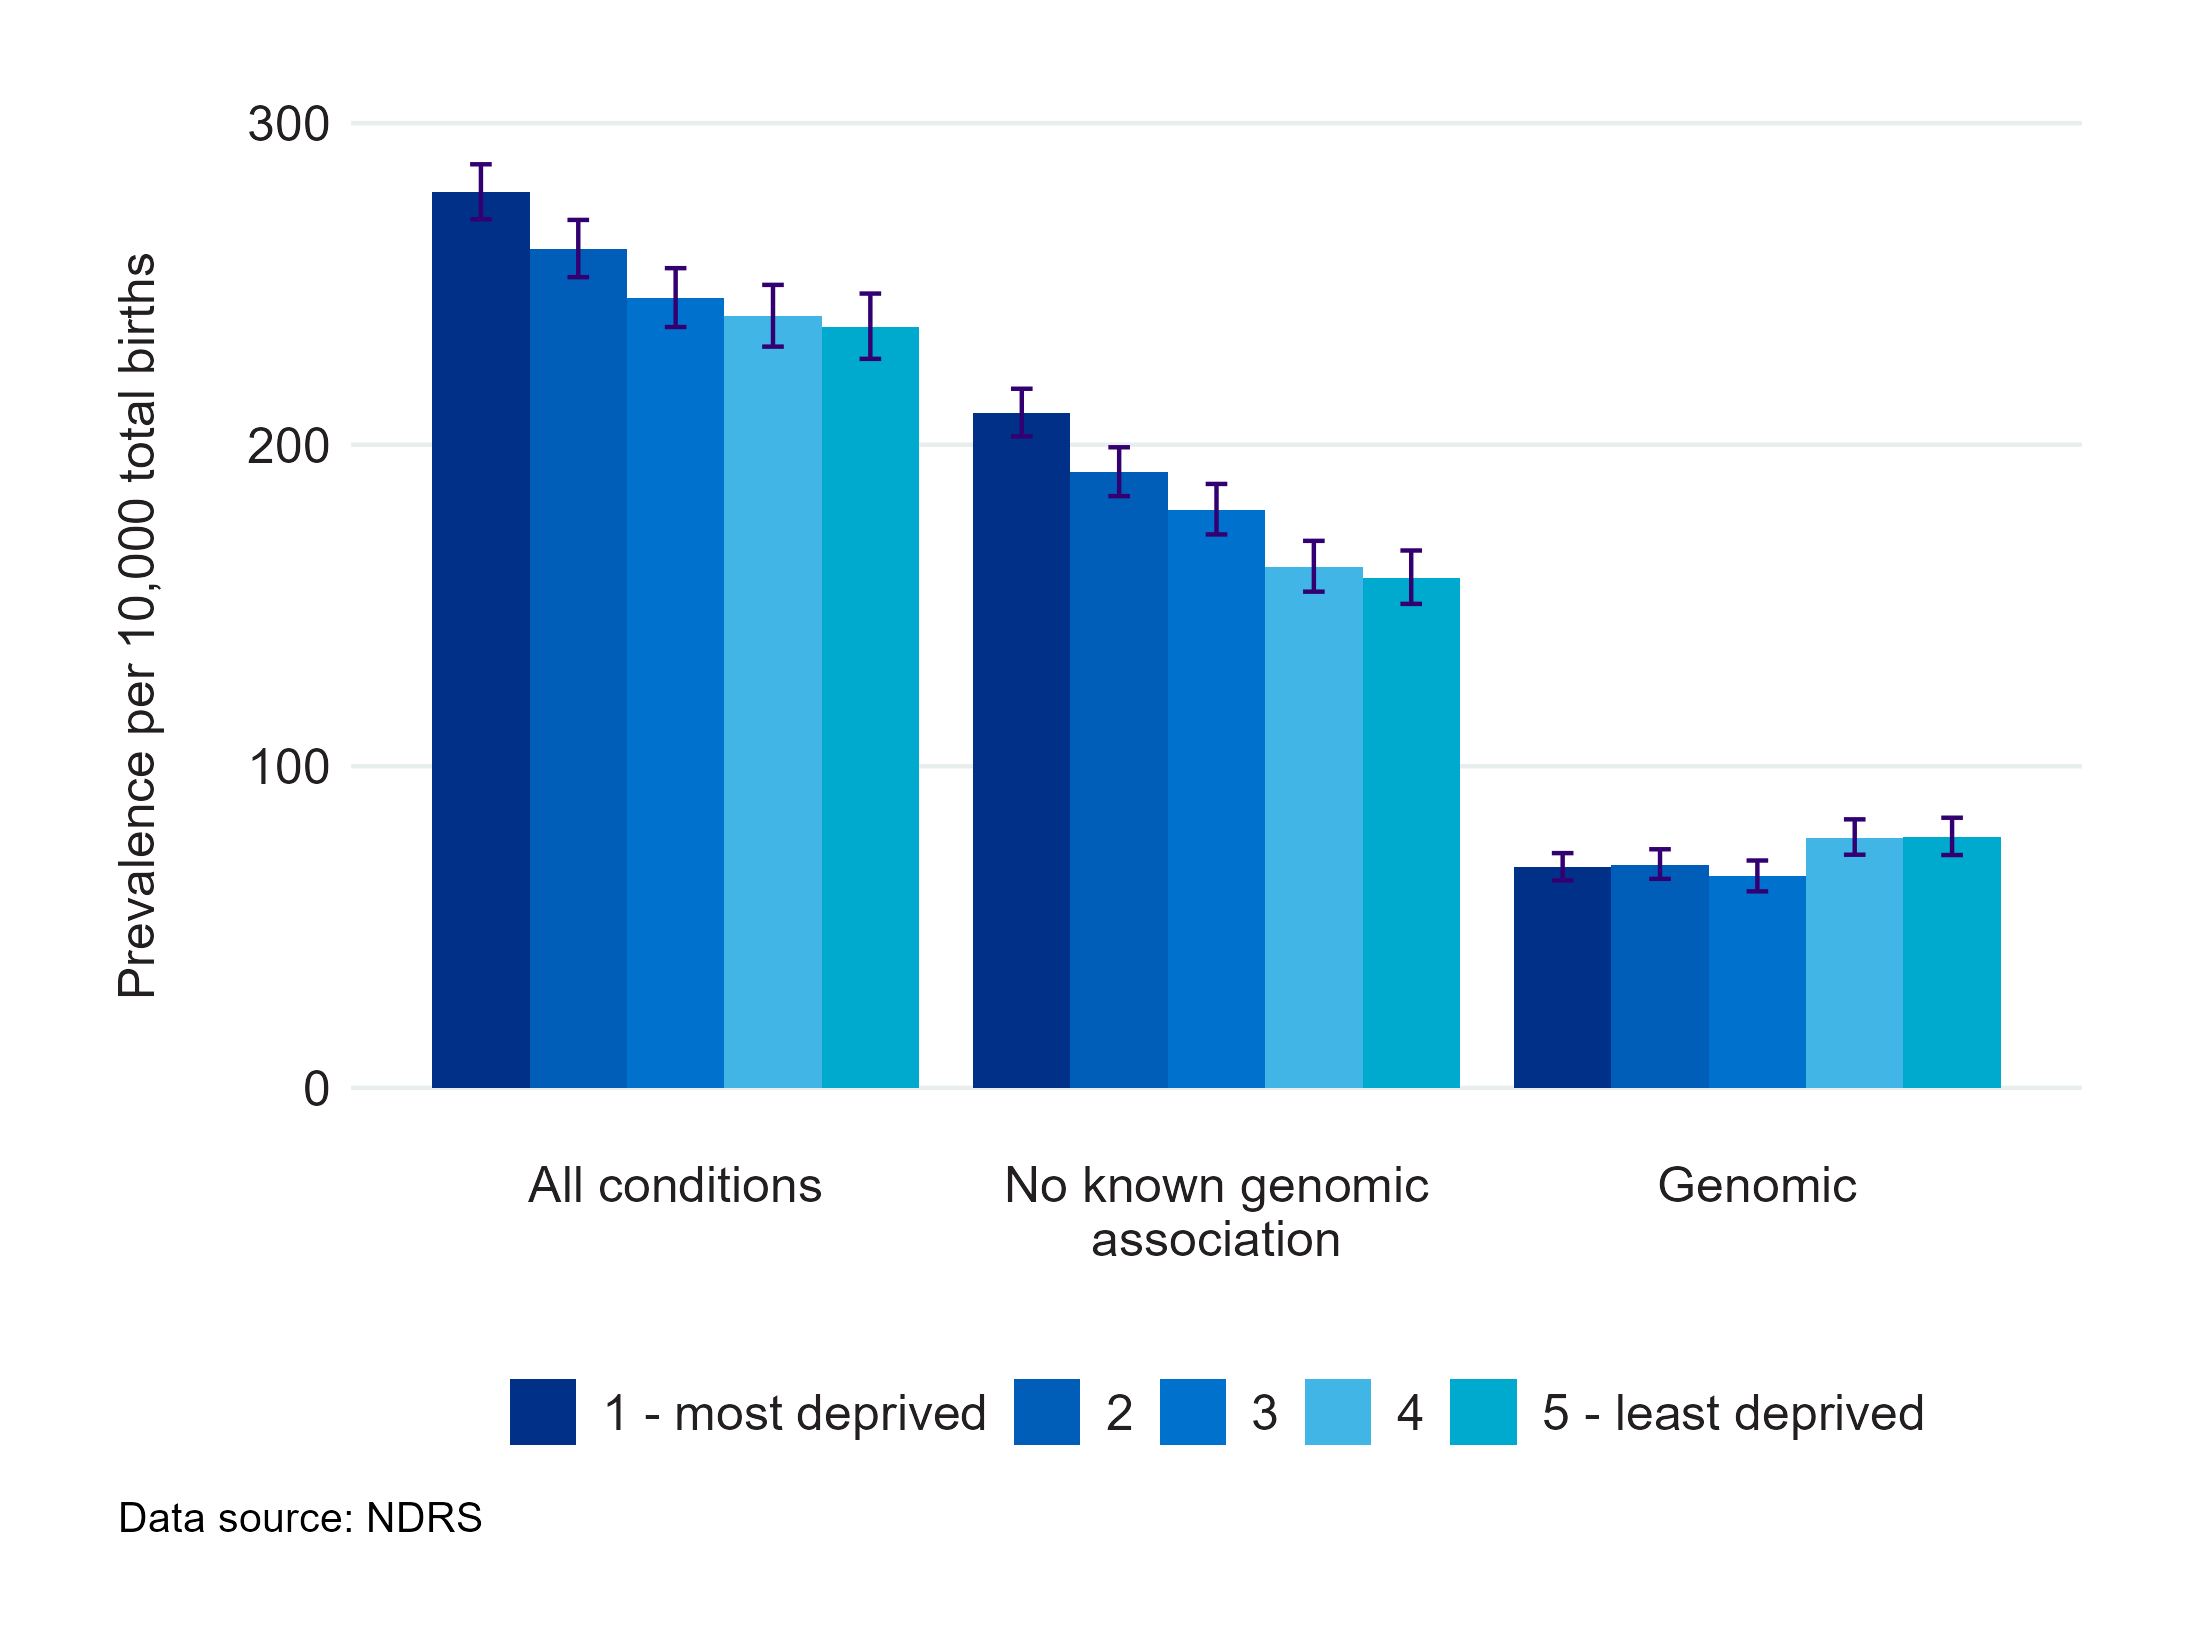
Figure 11 and Data table 11 show that the total birth prevalence of babies with any congenital condition was highest in the most deprived areas (278.6 per 10,000 total births, 95% CI 270.1-287.2) and lowest in the least deprived areas of England (236.7 per 10,000 total births, 95% CI 226.7-247.0). Overall, the risk of congenital conditions in babies in the most deprived areas was 17% higher compared to the least deprived areas (risk ratio 1.17, 95% CI 1.1-1.2).
For conditions with no identified genomic association, there is a clear and steeper gradient, with prevalence increasing as deprivation increases.
Data table 11 illustrates that for conditions with no identified genomic association the total birth prevalence was highest in the most deprived areas (209.9 per 10,000 total births, 95% CI 202.6-217.4) and lowest in the least deprived areas (158.6 per 10,000 total births, 95% CI 150.5-167.1). In the most deprived areas, there was a 32% increase in risk of conditions with no identified genomic association compared to the babies in the least deprived areas (risk ratio 1.3, 95% CI 1.2-1.4).
In contrast, total birth prevalence for babies with conditions with a known genomic association was relatively similar across quintiles of deprivation, with slightly higher values recorded in the least deprived areas.
The risk ratio for conditions with a known genomic association based on comparison between the most and the least deprived areas was close to null, with a value of 0.9 (95% CI 0.8-1.0), indicating little evidence of differences between the rates according to deprivation level. The relationship between deprivation and birth prevalence of congenital conditions with a confirmed genomic aetiology is complex and warrants further investigation. Data table 11 presents prevalence of babies with conditions with a known genomic association by age at delivery and deprivation quintiles.
Last edited: 3 November 2025 11:38 am