Publication, Part of NCARDRS Congenital Anomaly Statistics: Annual Data
NCARDRS Congenital Anomaly Official Statistics Report, 2021
Official statistics
2.2 Prevalence of major anomaly subgroups
More than a third (5,089; 36.1%) of babies diagnosed with congenital anomalies had more than one anomaly in 2021; this is one in 118 total births. For reporting, congenital anomalies are grouped into internationally-standardised categories broadly defined by the location in the body.
Figures 2a and 2b (Data table 1) show the prevalence of the 12 major congenital anomaly subgroups for:
a) all babies (total birth prevalence)
b) those that were live born (live birth prevalence).
In these figures, babies with multiple anomalies are counted in each applicable bar on the chart. For example, a baby with a congenital heart disease condition, limb and genetic conditions would be represented in each of the three different bars, and in dark blue in the bars of the respective structural condition (congenital heart disease and limb).
Conditions categorised as “genetic” include those babies with an identified chromosomal anomaly, skeletal dysplasia, genetic syndrome or other genetic conditions.
Non-genetic conditions are structural conditions that include babies with at least one congenital anomaly with no identified genetic aetiology.
Structural conditions with any associated genetic diagnosis are represented by the dark blue part of the respective bar chart. These are conditions with a known genetic diagnosis, but this requires genetic testing to be offered, accepted and then to deliver a diagnostic result.
The light blue portion of the bar chart include babies where a genetic result was negative, or where testing was not offered or did not take place. It is important to note that not all babies undergo genetic testing, and it is inevitable that some of these non-genetic conditions will have an undisclosed underlying genetic aetiology.
Total birth prevalence of major anomaly subgroups
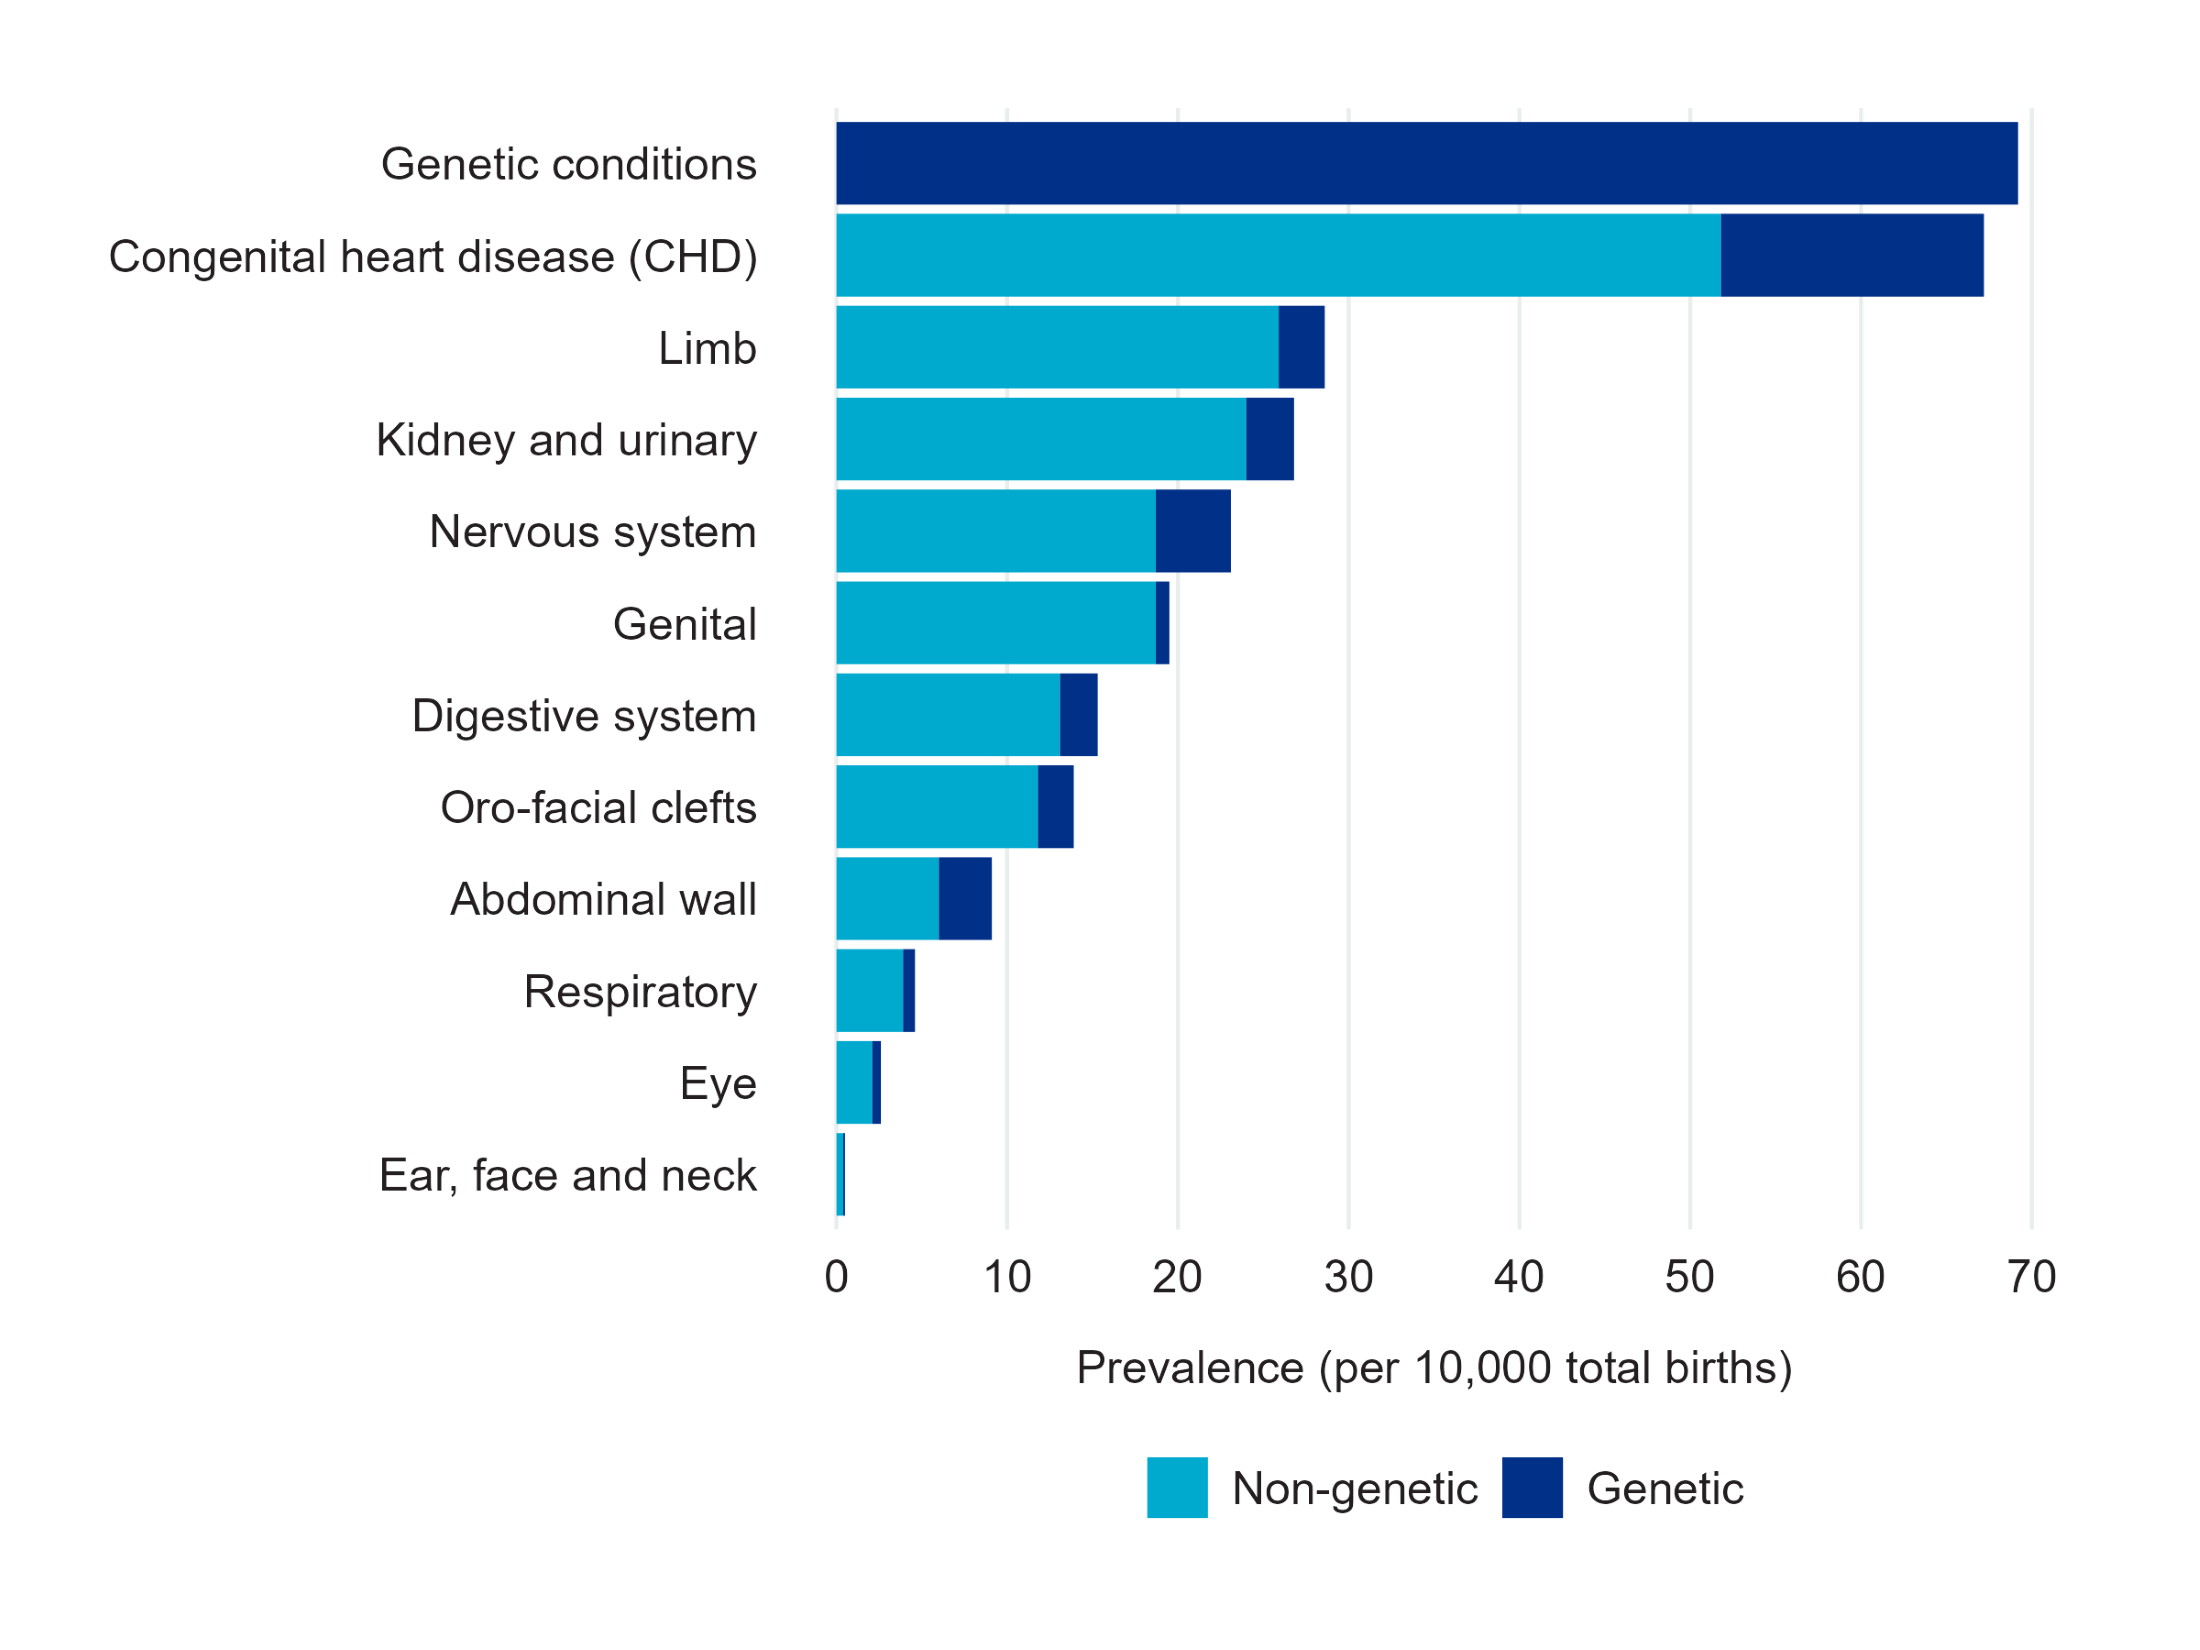
Figure 2a and Data table 1 show that total births prevalence in 2021 was highest for the genetic conditions (69.2 per 10,000 total births, 95% CI 67.2-71.4), followed by the congenital heart disease subgroup (67.2 per 10,000 total births, 95% CI 65.1-69.3), then by limb anomalies (28.6 per 10,000 total births, 95% CI 27.2-30.0) and anomalies of the kidney and urinary tract (26.8 per 10,000 total births, 95% CI 25.5-28.1).
This is the first time since NCARDRS began reporting that the prevalence of genetic conditions has exceeded that of cardiac conditions. This likely reflects improved ascertainment of genetic laboratory data and an increase in the volume and sensitivity of genetic testing activity resulting in the identification of more babies with anomalies with underlying genetic aetiologies.
Figure 2a: Total birth prevalence: number of babies with a congenital anomaly, per 10,000 total births, by congenital anomaly subgroup and aetiology in England and the Crown Dependencies, 2021
Live birth prevalence by anomaly group
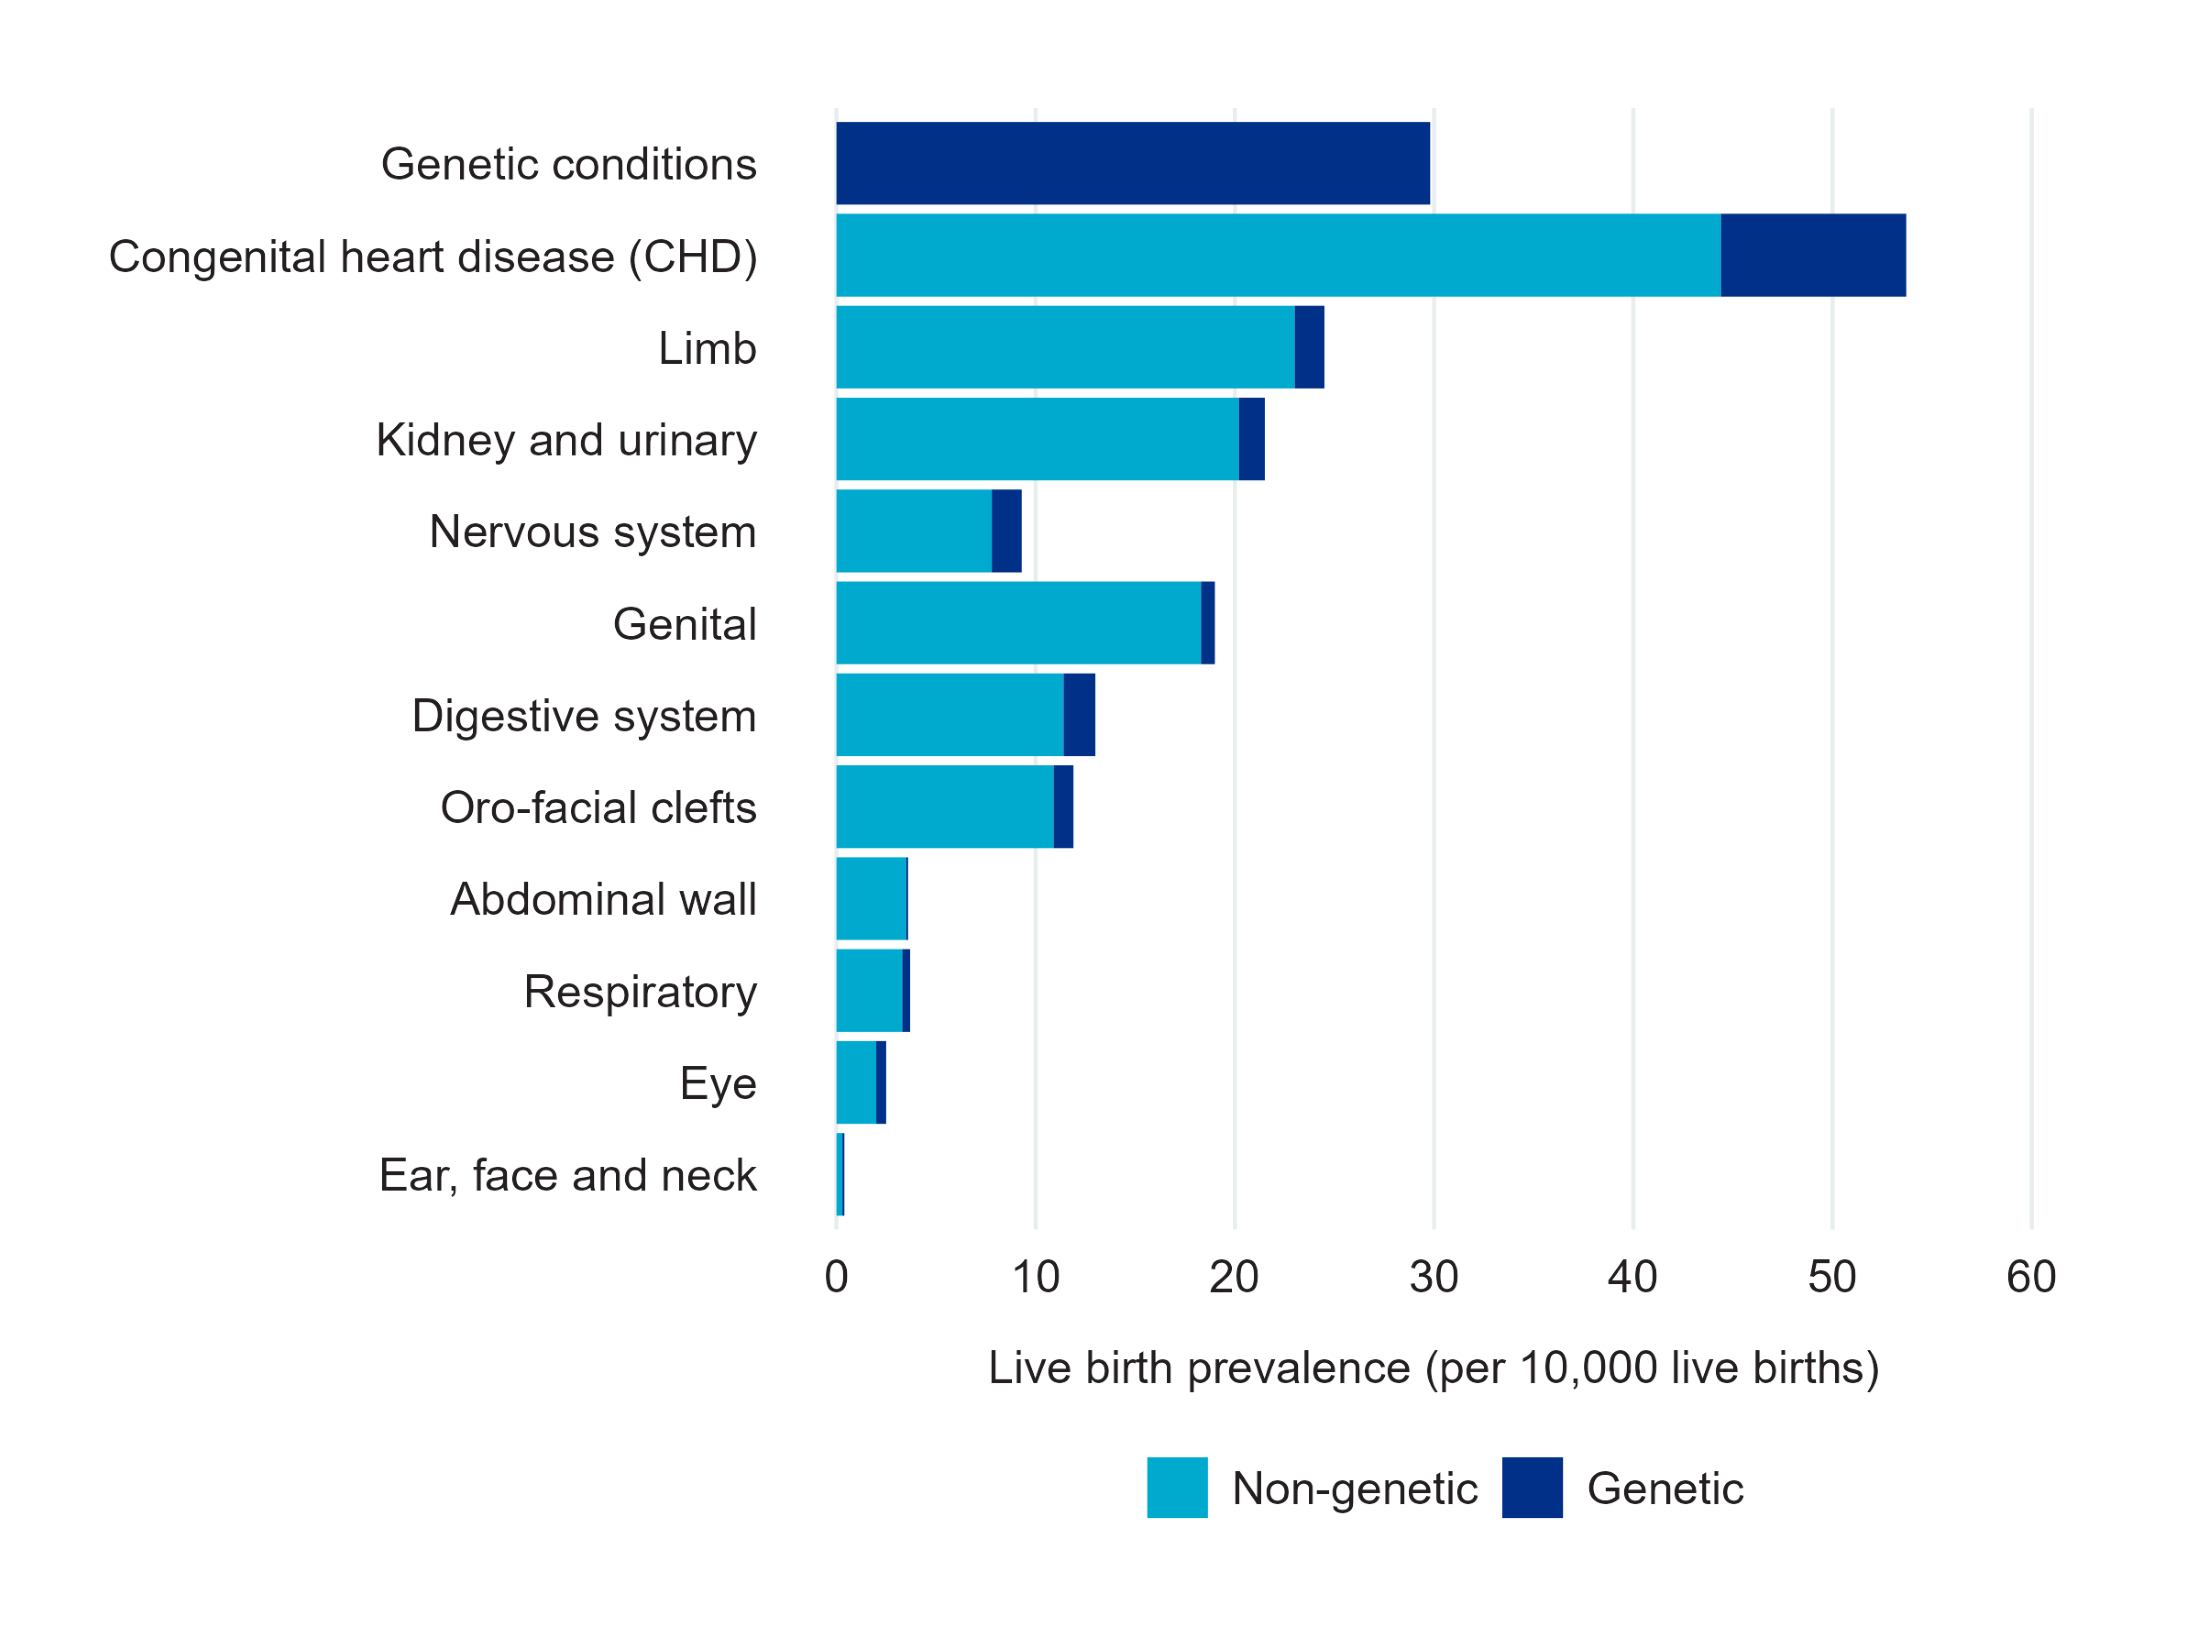
Figure 2b and Data table 1 show that the prevalence for those who are born alive was highest in congenital heart disease conditions (53.7 per 10,000 live births, 95% CI 51.9-55.6), followed by the genetic conditions subgroup (29.8 per 10,000 live births, 95% CI 28.4-31.2), the limb anomalies subgroup (24.4 per 10,000 live births, 95% CI 23.3-25.8) and congenital anomalies of the kidneys and urinary tract (21.5 per 10,000 live births, 95% CI 20.4-22.7).
The pattern for all babies diagnosed with a congenital anomaly, and those that are born alive, is similar for most subgroups apart from genetic and nervous system anomalies. The total and live birth prevalence for conditions of the nervous system is, respectively 23.1 per 10,000 total births (95% CI 21.9-24.4) and 9.3 per 10,000 live births (CI 8.5-10.1). The lower live born prevalence compared to total birth prevalence in these two anomaly groups reflects the severity of some of the conditions in these subgroups, which rarely result in a live birth.
Figure 2b: Live birth prevalence: number of babies with a congenital anomaly, per 10,000 live births, by congenital anomaly subgroup and aetiology in England and the Crown Dependencies, 2021
Last edited: 27 March 2024 2:26 pm