Publication, Part of NCARDRS Congenital Anomaly Statistics: Annual Data
NCARDRS Congenital Anomaly Official Statistics Report, 2021
Official statistics
4.3 Important public health indicators: Deprivation
For the first time, NCARDRS reports on total birth prevalence (per 10,000 total births) of congenital anomalies by deprivation, using the Index of Multiple Deprivation (IMD). The IMD measures deprivation for small geographical areas across England, the 2011 Lower-layer Super Output Areas (LSOAs), using multiple combined domains. The IMD rank is used to group LSOAs into quintiles, dividing the LSOAs into 5 equal groups, from quintile 1 showing the most deprived 20% of LSOAs to quintile 5 showing the least deprived 20% of LSOAs.
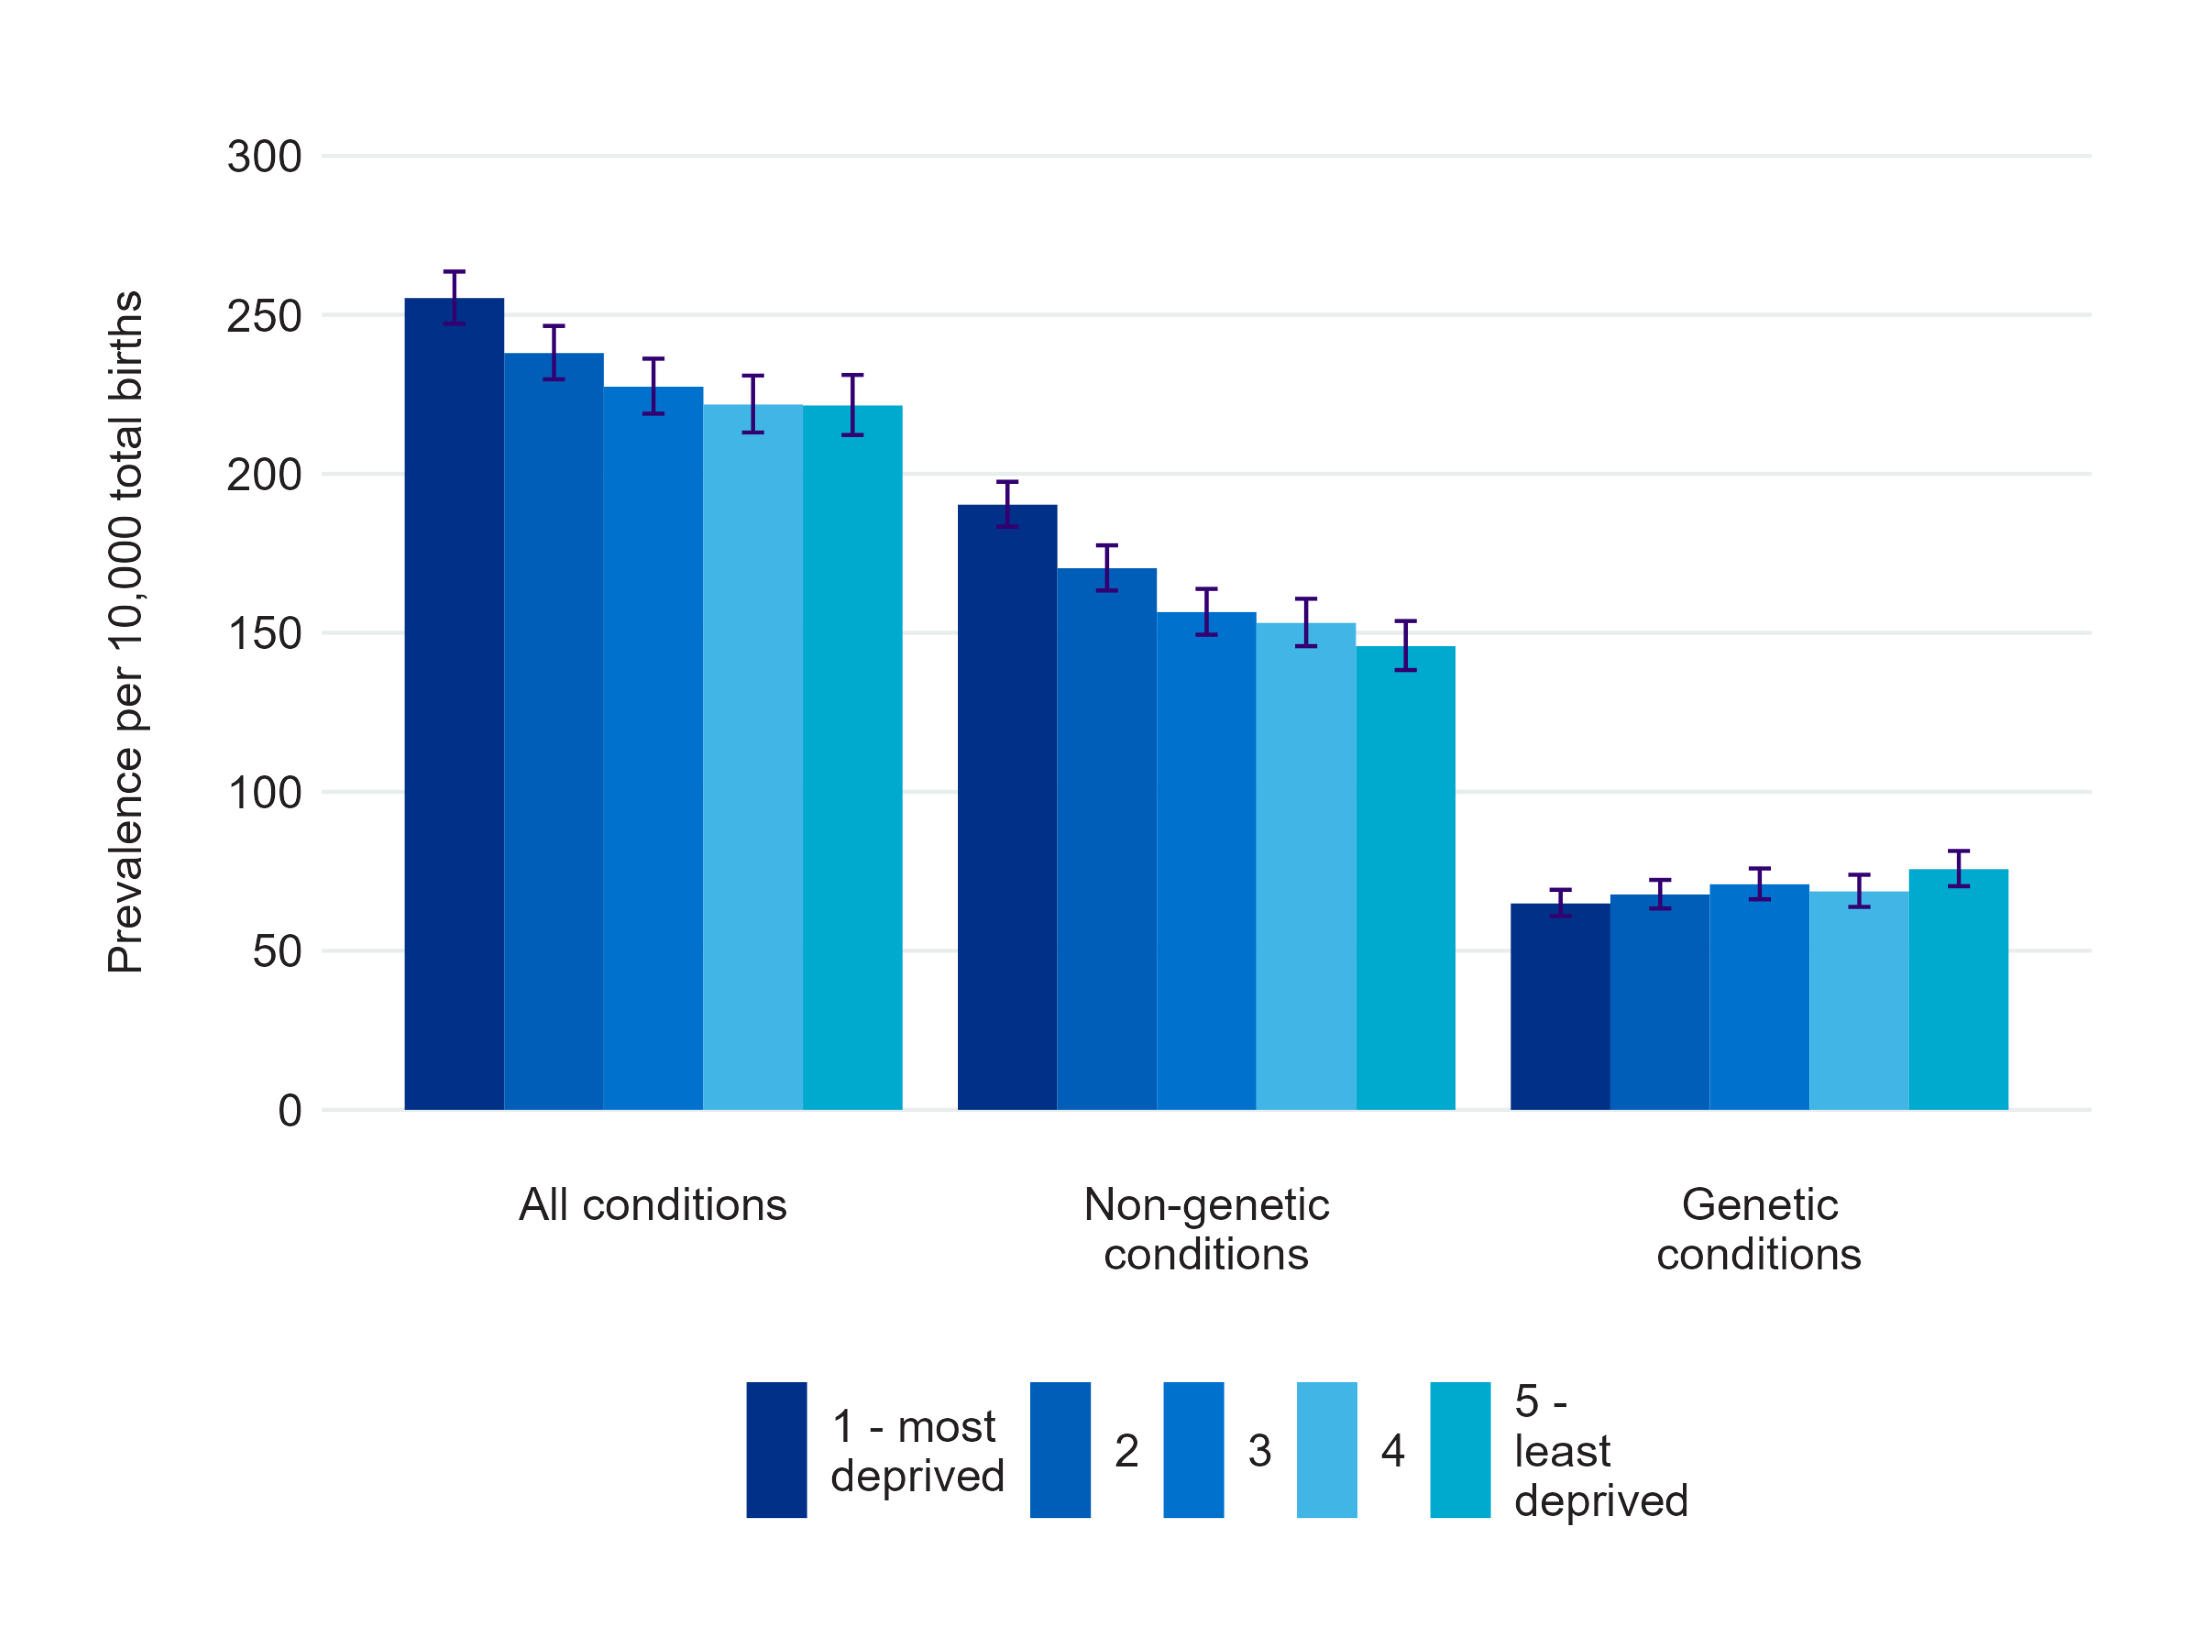
Congenital anomaly prevalence was higher in areas of high deprivation overall and for non-genetic conditions. Figure 11 and Data table 11 show that the total birth prevalence of babies with any congenital anomaly was 15.3% higher in the most deprived areas (255.3 per 10,000 total births, 95% CI 247.2-263.6) than in the least deprived areas of England (221.5 per 10,000 total births, 95% CI 212.2-231.1). Overall, the risk of congenital anomalies in babies in the most deprived areas was 15% higher compared to the least deprived areas (risk ratio 1.15, 95% CI 1.1-1.2).
For non-genetic conditions, there is a clear and steeper gradient, with prevalence increasing as deprivation increases. Data table 11 illustrates that for non-genetic conditions the total birth prevalence was 30.5% higher in the most deprived areas (190.3 per 10,000 total births, 95% CI 183.4-197.5) compared with the least deprived areas (145.8 per 10,000 total births, 95% CI 138.3-153.7). In the most deprived areas there was a 30.0% increase in risk of non-genetic conditions compared to the babies in the least deprived areas (risk ratio 1.3, 95% CI 1.2-1.4).
In contrast, total birth prevalence for babies with genetic conditions was relatively similar across quintiles of deprivation, with slightly higher values recorded in the least deprived areas. The risk ratio for genetic conditions based on comparison between the most and the least deprived areas is close to null, with a value of 0.9 (95% CI 0.8-1.0). The relationship between deprivation and birth prevalence of congenital conditions with a genetic aetiology is more complex and likely confounded by higher pregnant person age in areas of low deprivation.
Figure 11. Total birth prevalence of congenital anomalies by index of multiple deprivation quintile in England, 2021
Last edited: 27 March 2024 2:26 pm