Publication, Part of NCARDRS Congenital Anomaly Statistics: Annual Data
NCARDRS Congenital Anomaly Official Statistics Report, 2021
Official statistics
4.2 Important public health indicators: Pregnant person age
Data table 9 shows that the total birth prevalence of babies with any congenital anomaly was significantly higher in pregnant persons aged 40 years and over (449.0 per 10,000 total births, 95% CI 452.2-473.7), followed by those aged 35 to 39 years (268.1 per 10,000 total births, 95% CI 258.9-277.5), as compared to the other age groups. Total birth prevalence rates were similar in pregnant people aged under 35.
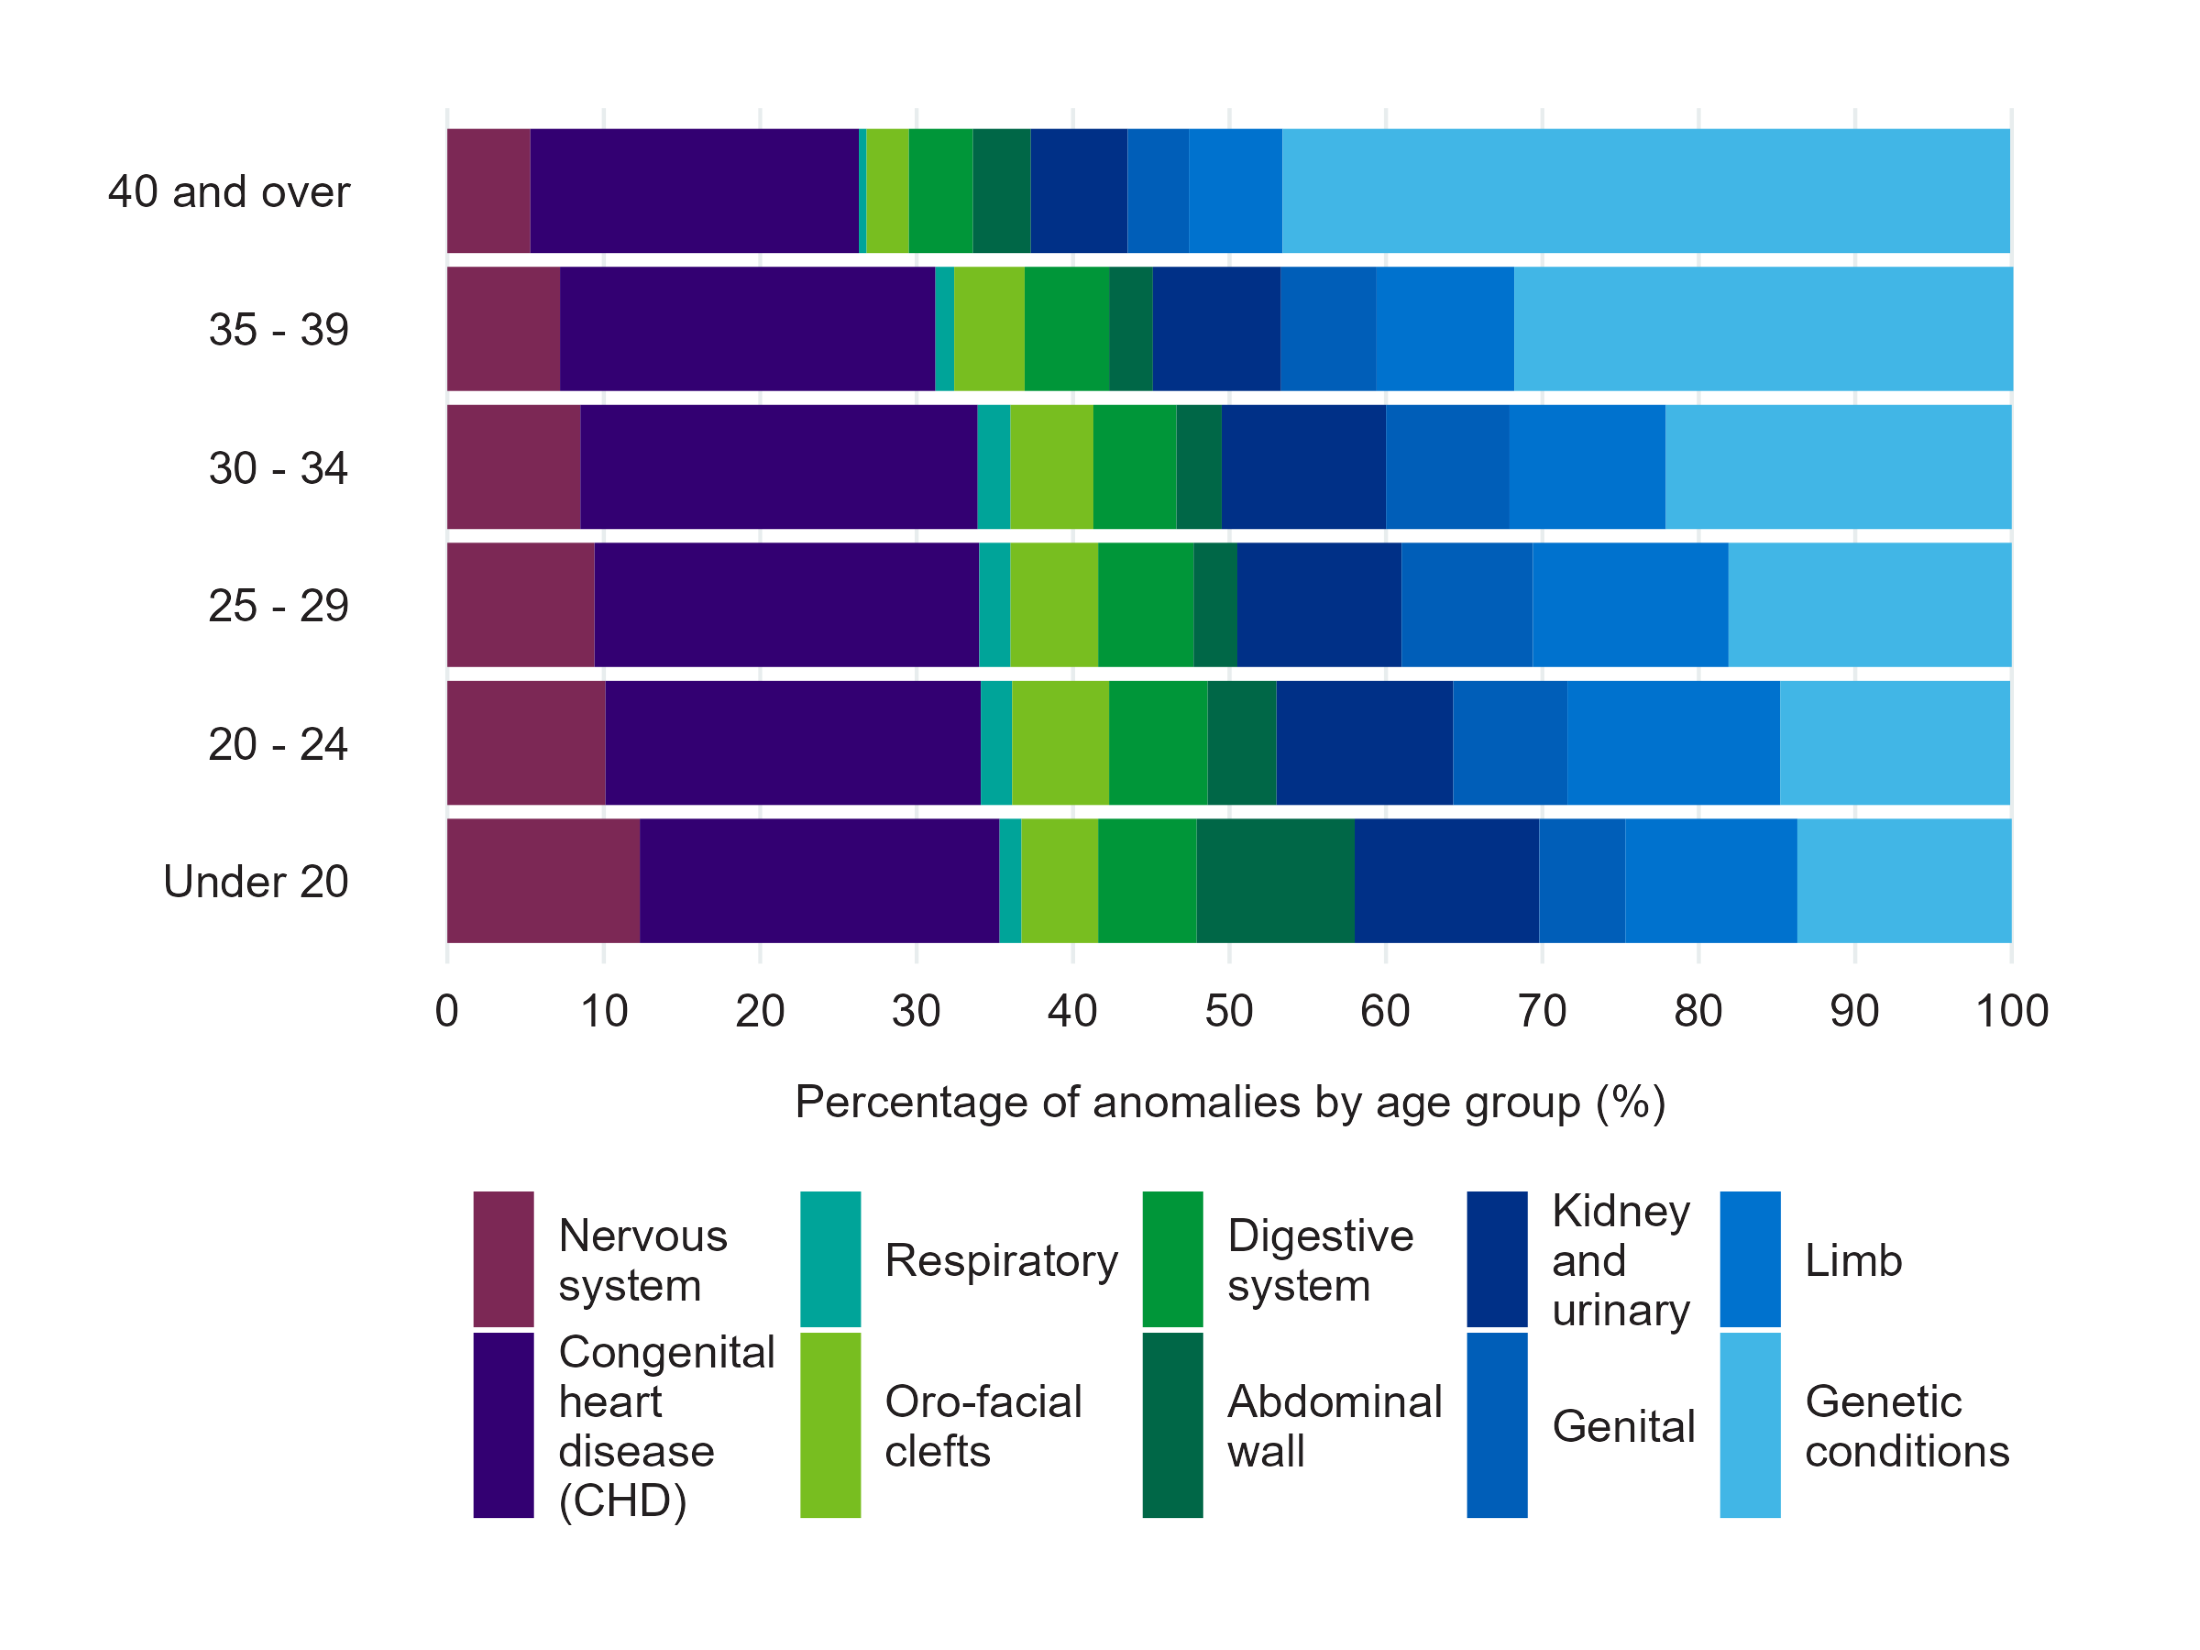
As reported in Data table 9, the total birth prevalence of babies with abdominal wall anomalies in the under 20 age group (28.5 per 10,000 total births, 95% CI 20.1-39.3) was higher than in all other age groups. Figure 10 illustrates that the type of anomaly identified varied by pregnant person age. Genetic conditions were present in a higher proportion of babies born to pregnant persons aged 40 and over, compared to all other age groups. The rate of genetic conditions in babies in this highest prevalence group (264.7 per 10,000 total births, 95% CI 246.6-283.9) was significantly higher relative to the lowest prevalence group, pregnant people aged between 20 and 24 years (37.0 per 10,000 total births, 95% CI 32.7-41.8); this difference is statistically significant, with a risk ratio equal to 6.9 (95% CI 6.1-8.0) between the two age groups.
Data table 10 reports that the rate of non-genetic conditions in babies born to pregnant people under 20 years of age (191.7 per 10,000 total births, 95% CI 168.6-217.0) is higher than the rate in pregnant people aged between 30 and 34 (156.4 per 10,000 total births, 95% CI 151.1-161.9).
Figure 10: The proportion of babies with an anomaly in each congenital anomaly group by pregnant person age (percentage values) in England, 2021
Last edited: 27 March 2024 2:26 pm