Publication, Part of NCARDRS Congenital Anomaly Statistics: Annual Data
NCARDRS Congenital Anomaly Official Statistics Report, 2021
Official statistics
2.1 Total birth prevalence of congenital anomalies
Birth prevalence describes the occurrence of congenital anomalies and is used to quantify the proportion of babies born with these conditions in a population in a year. See the annex Technical details for the formulae used in this report to compute prevalence.
Total prevalence and live birth prevalence are the two most frequently used measures to describe congenital anomalies. Total prevalence is defined as the total number of babies with at least one congenital anomaly occurring in all pregnancy outcomes (live births, stillbirths, late miscarriages between 20-23 complete weeks and terminations at any gestation) per 10,000 live births and stillbirths (total births).
Data table 1 shows that a total of 14,085 babies with one or more congenital anomalies were notified to NCARDRS in 2021 out of 600,465 total births (live births and stillbirths) in England. This gives a total birth prevalence of babies with congenital anomalies of 234.6 per 10,000 total births (95% confidence intervals (CI) 230.7-238.5).
This means that one baby was diagnosed with a congenital anomaly for every 43 total births (live births and stillbirths).
Live birth prevalence is the total number of babies with congenital anomalies occurring in live births per 10,000 live births. In 2021, 10,119 babies with at least one congenital anomaly were born alive, giving a live birth prevalence of 169.1 per 10,000 live births (95% CI 165.9-172.5). This means that one baby was diagnosed with a congenital anomaly for every 59 live births.
Total birth prevalence of all congenital anomalies by region
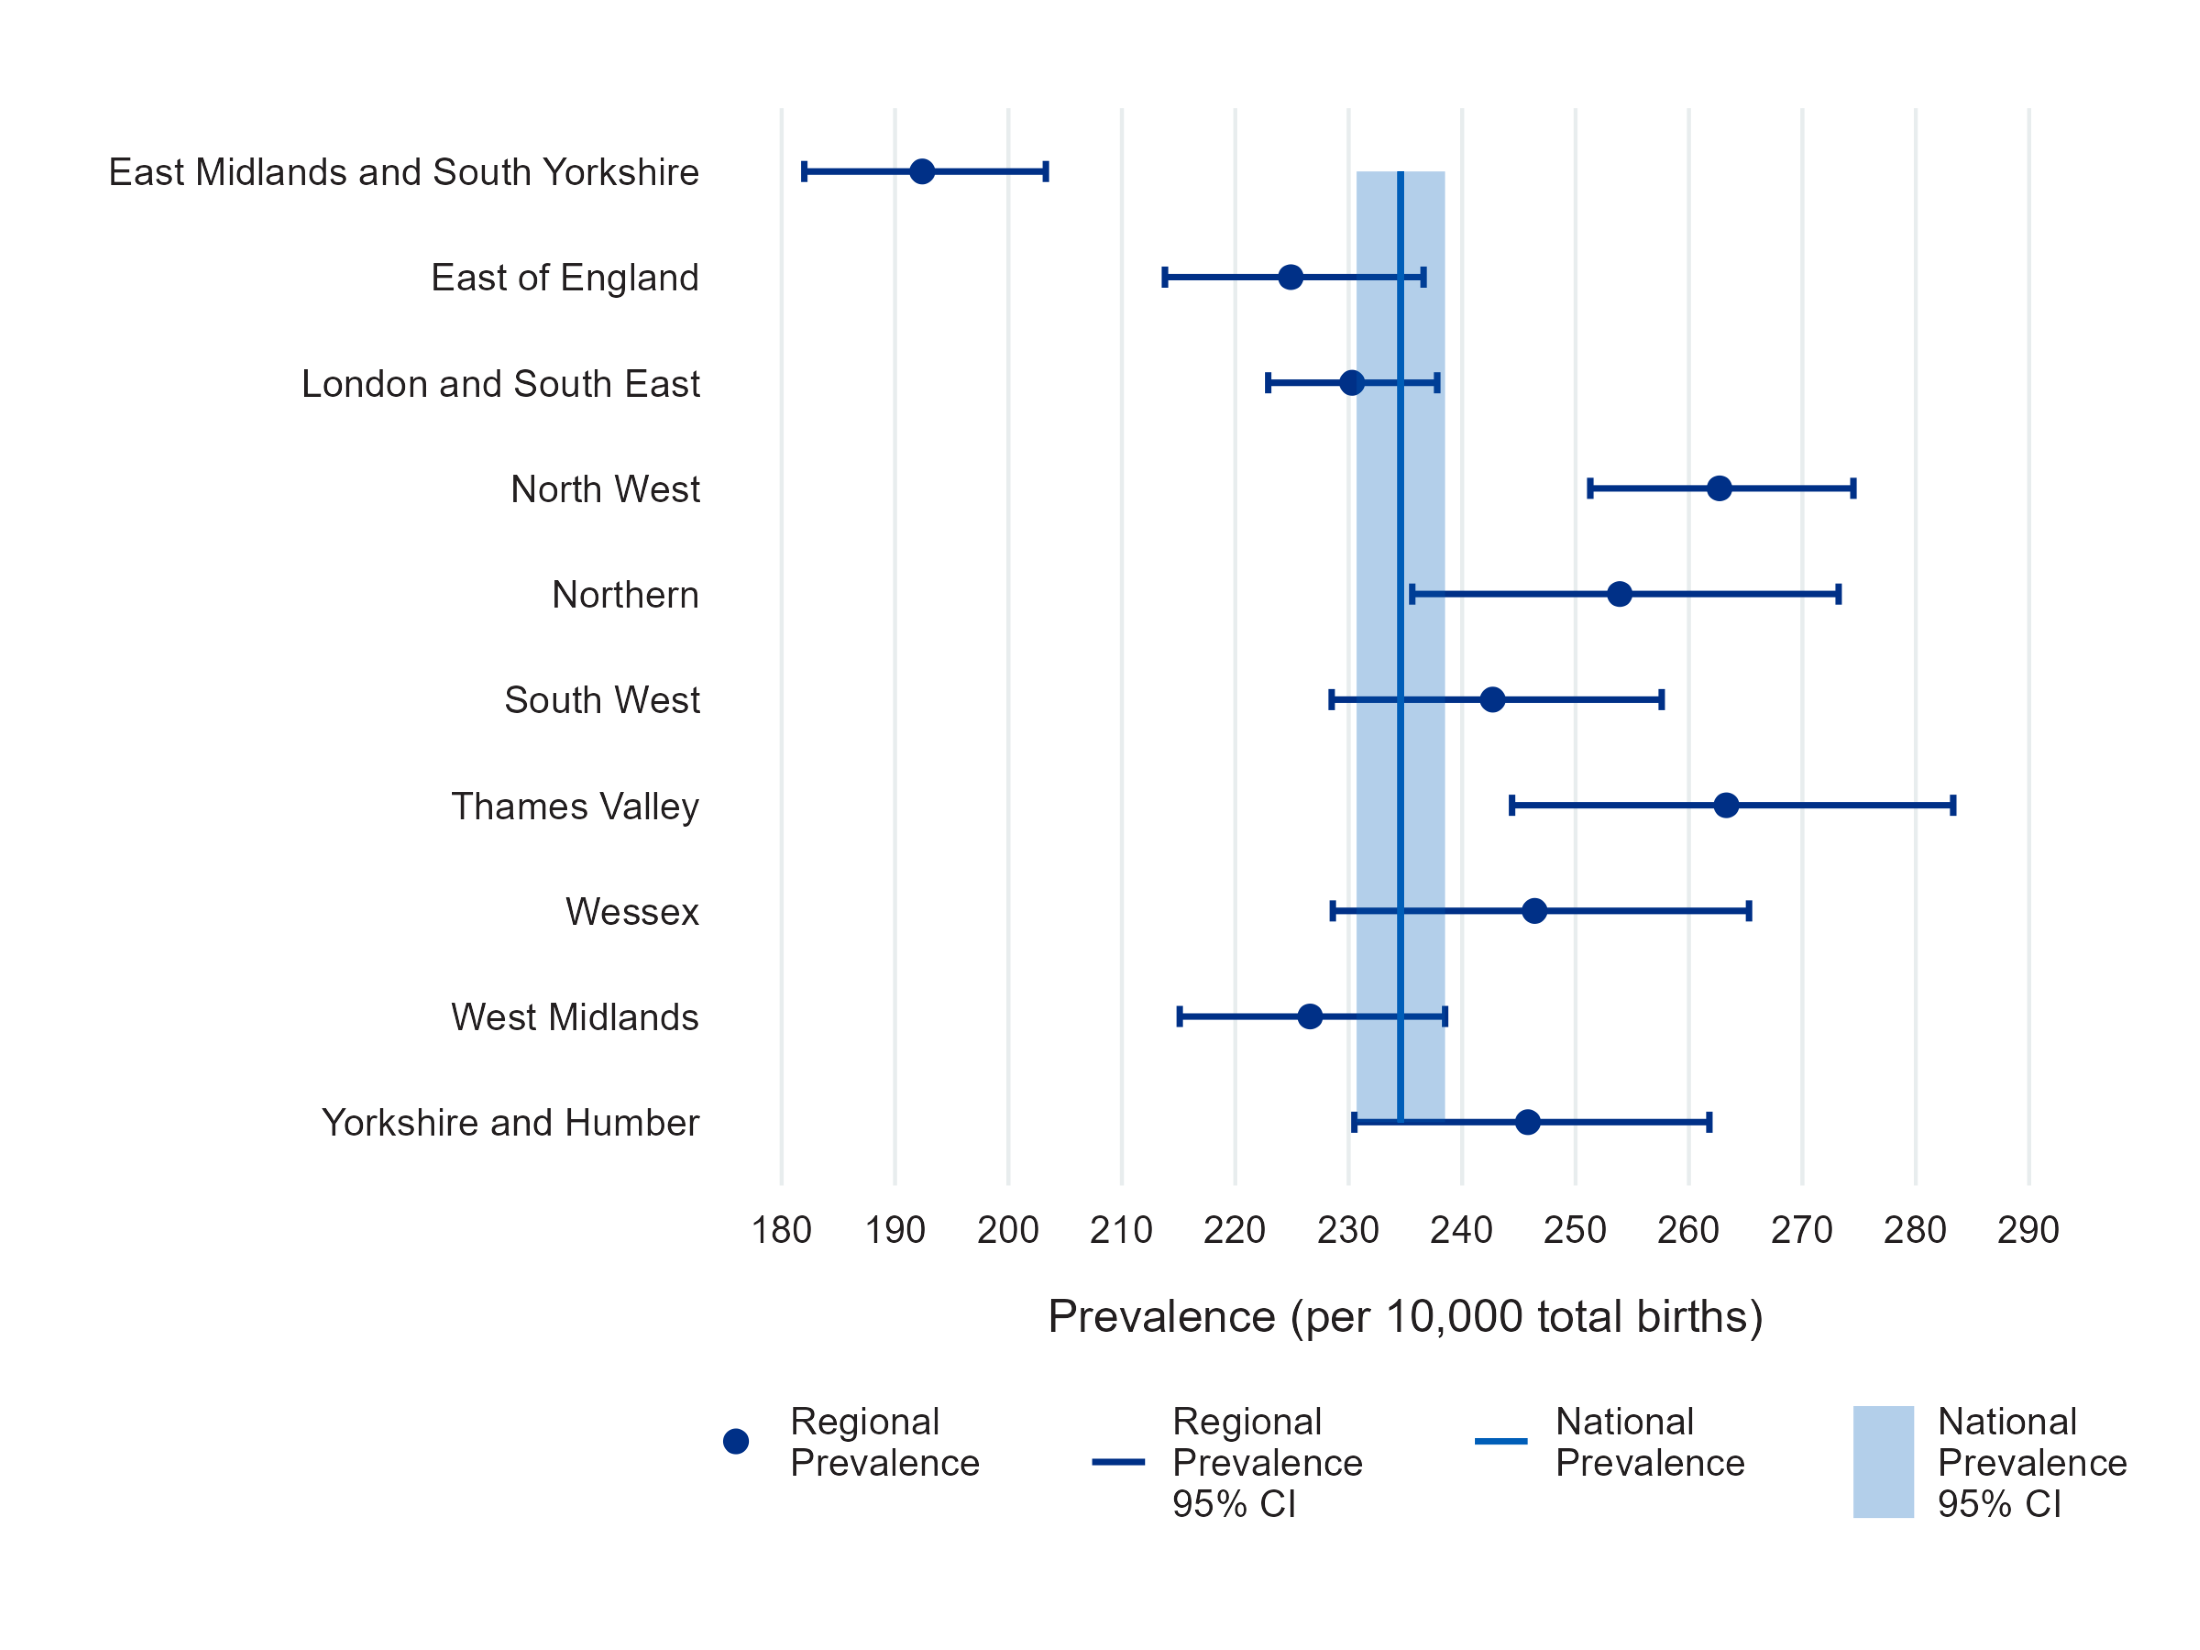
Figure 1a and Data table 2a show that the total birth prevalence (the number of babies diagnosed with at least one congenital anomaly per 10,000 total births) in 2021 varied by region. A full description of regional boundaries is available in the Technical details. Prevalence per 10,000 total births was highest in the Thames Valley region (263.3, 95% CI 244.4-283.3) and lowest in East Midlands and South Yorkshire (192.4, 95% CI 182.0-203.3).
There is less regional variation in the overall prevalence of congenital anomalies in 2021 as compared to previous years. Total birth prevalence estimates in all regions, other than East Midlands and South Yorkshire, were consistent with or higher than the average prevalence in England in 2021. The prevalence in London and the South East and in East of England was significantly higher in 2021 compared to 2020. This is in contrast to 2020, where prevalence in three regions (London and the South East, East of England and East Midlands and South Yorkshire) was significantly below the national average.
This improvement in data quality reflects the maturation of data collection since the establishment of NCARDRS in 2015. NCARDRS continues to work nationally, including reducing reliance on local extracts and notifications as we increase access to national datasets. NCARDRS are working to secure remote access to tertiary trusts to ensure that suspected anomalies and pregnancy outcomes can be confirmed as reportable.
Figure 1a: The number of babies with at least one congenital anomaly per 10,000 total births (prevalence) and 95% confidence intervals for regions in England and the Crown Dependencies, 2021
Total birth prevalence of Fetal Anomaly Screening Programme (FASP) anomalies by region
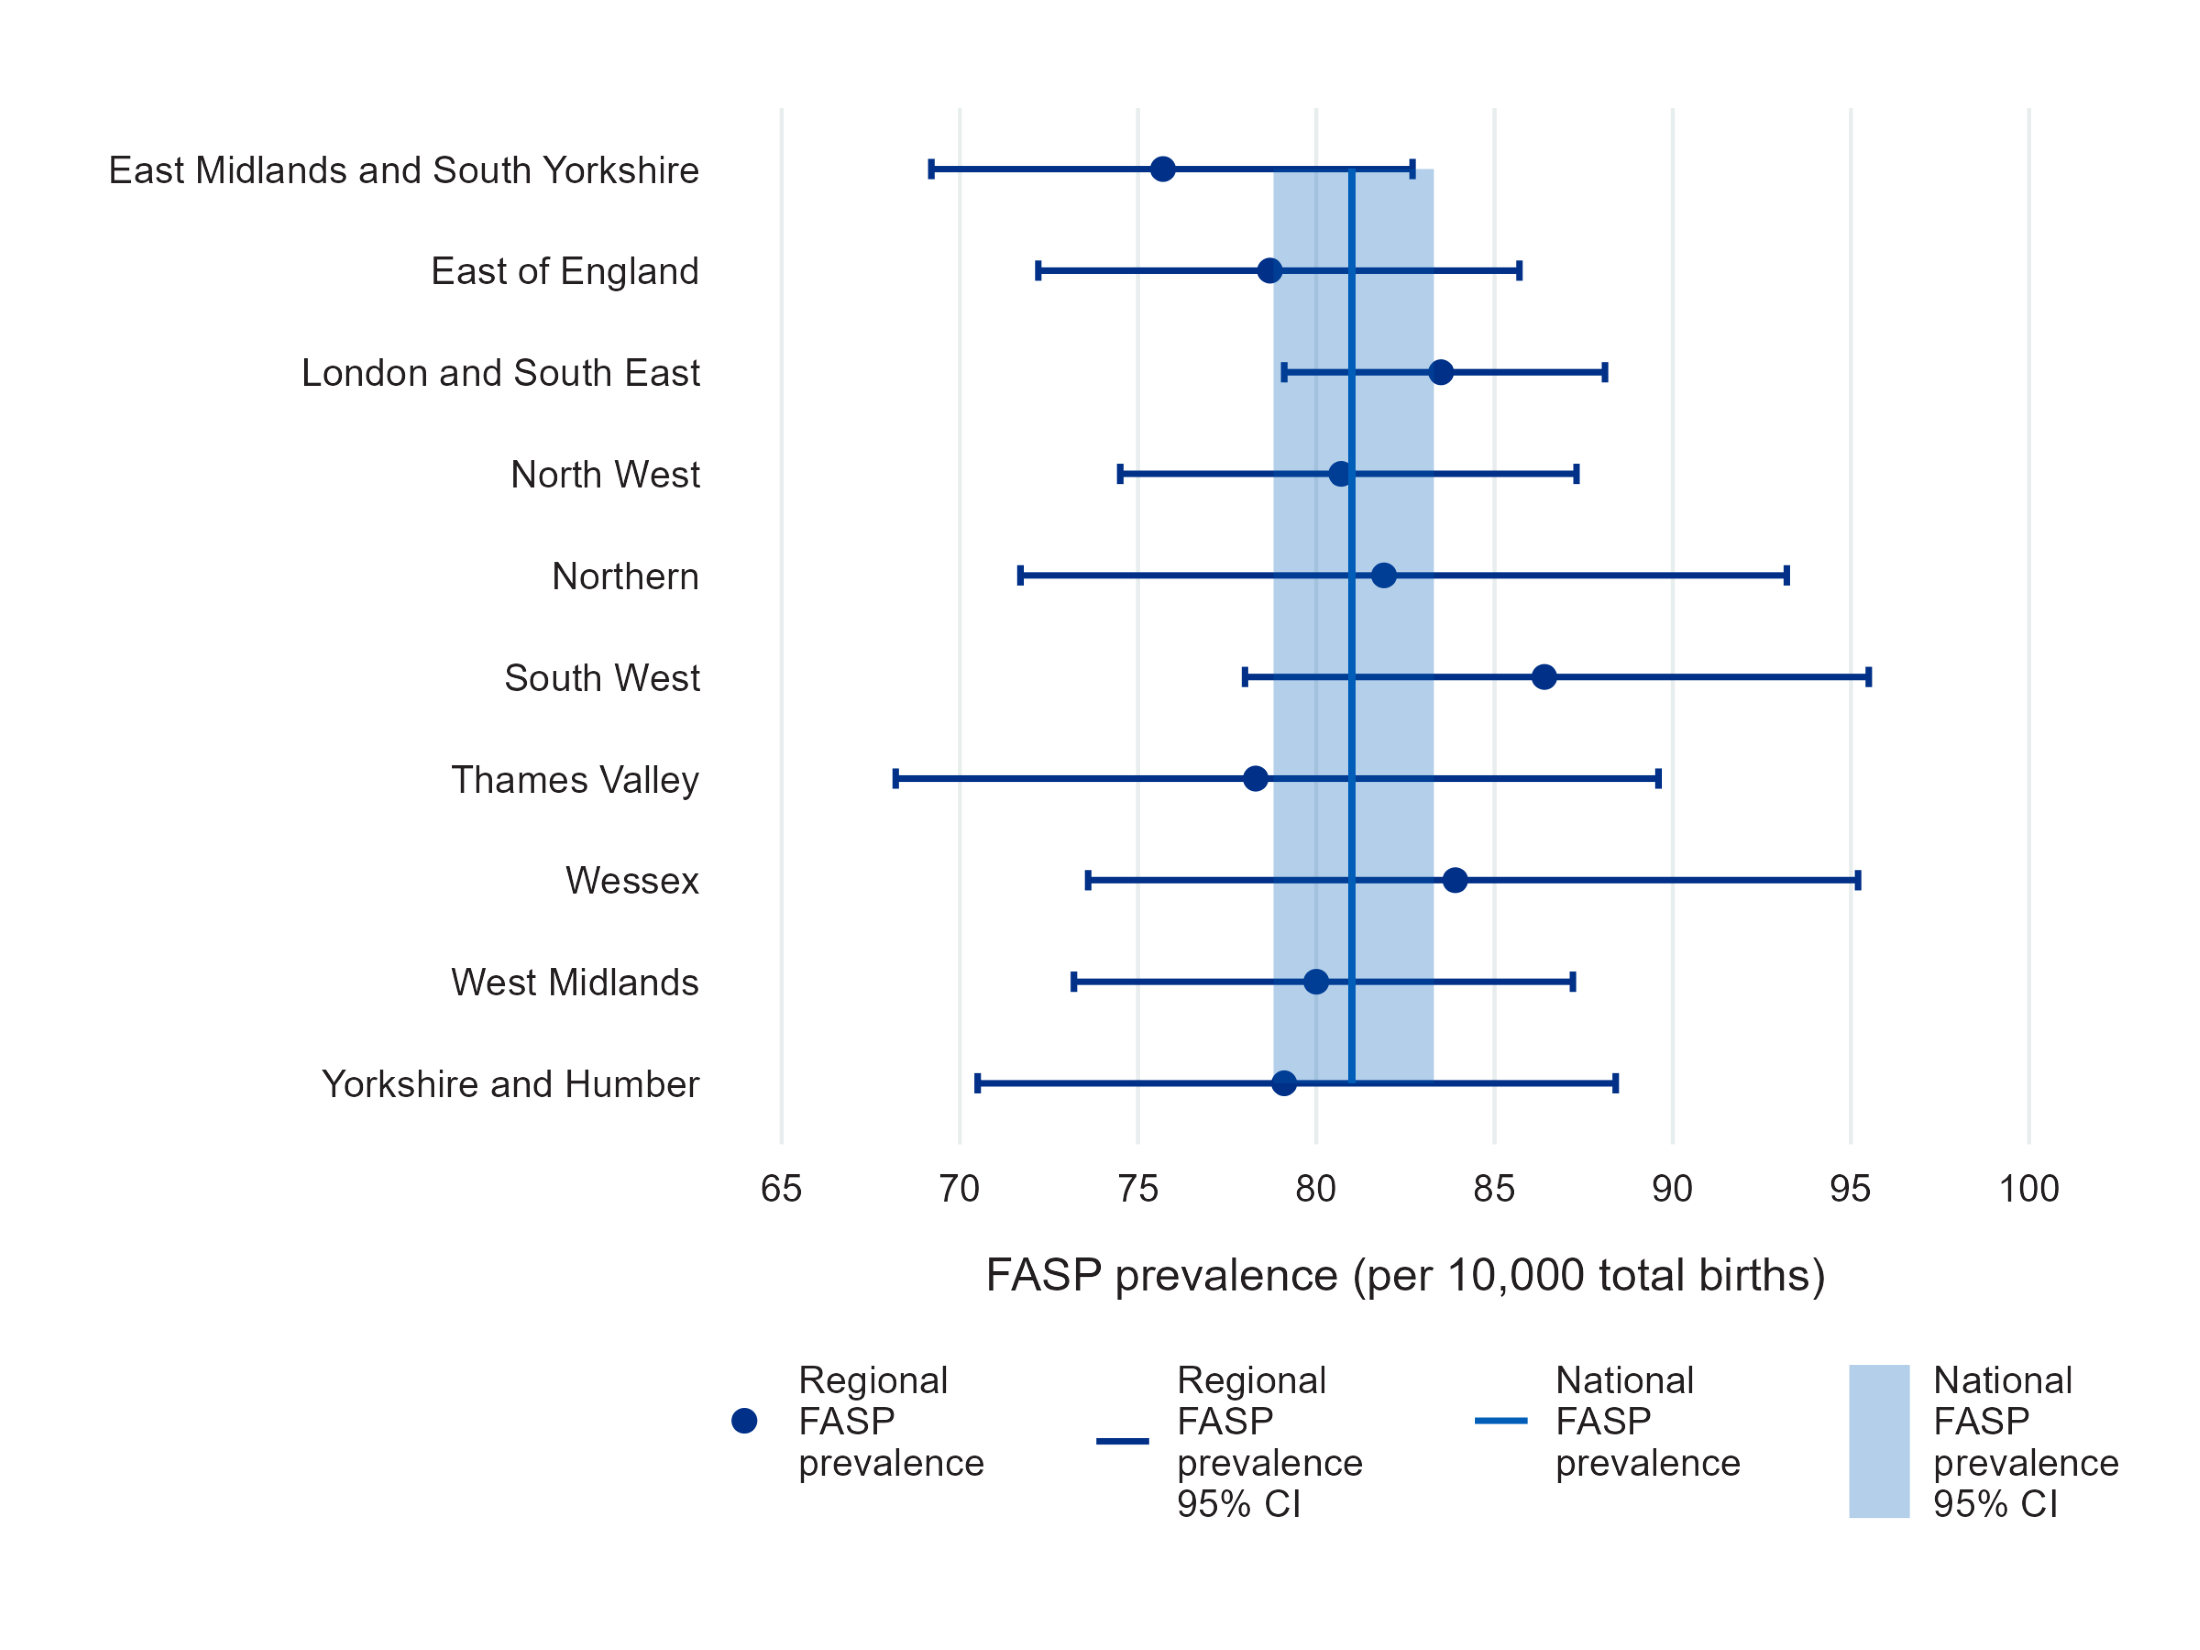
Figure 1b and Data table 2b show that prevalence across regions was more consistent when regional prevalence is restricted to babies with at least one of the conditions audited by the NHS Fetal Anomaly Screening Programme (FASP). NCARDRS has worked in partnership with the FASP programme since 2015, auditing detection rates for three trisomy conditions, four severe cardiac conditions, two abdominal wall conditions, along with spina bifida, anencephaly, severe skeletal dysplasia, cleft lip and/or palate, bilateral renal agenesis and congenital diaphragmatic hernia. As part of this work, FASP conditions are subject to more intensive reporting, resulting in higher data quality.
Figure 1b: The number of babies with at least one congenital anomaly that is a FASP condition per 10,000 total births (prevalence) and 95% confidence intervals, for regions in England and the Crown Dependencies, 2021
Why are there differences across regions?
Geographical variation in congenital anomaly prevalence is most likely associated with differences in case ascertainment resulting from different data sources, access to remote data systems and the regional variation in the length of time registration has been established. However, there are other reasons which could influence the results presented, such as disease clustering, exposure to teratogens, demographic variation including pregnant person age, deprivation profiles between regions and the composition of the local population.
As NCARDRS accumulates more data at a national level over time, and registration in newer regions matures, greater insights will be gained into underlying population characteristics contributing to regional variation, as well as the ability to analyse associations with lifestyle and environmental factors, which may potentially be modifiable.
Last edited: 27 March 2024 2:26 pm