Publication, Part of NCARDRS Congenital Anomaly Statistics: Annual Data
NCARDRS Congenital Anomaly Official Statistics Report, 2020
Official statistics
2.2 Prevalence of major anomaly subgroups
Figures 2a and 2b (Data table 1) show the prevalence of the 10 major congenital anomaly subgroups for:
a) all babies
b) those that were live born.
More than a third (N= 4,773; 36.5%) of babies had more than one anomaly in 2020; this is one in 124 total births. In these figures, babies with multiple anomalies are counted in each applicable bar on the chart. For example, a baby with a congenital heart, limb and genetic condition would be represented in each of the three different bars, and in dark blue in the bars of the respective structural condition (heart and limb). Conditions categorised as “genetic” include those babies with an identified chromosomal anomaly, skeletal dysplasia, genetic syndrome or other genetic disorders. Non-genetic conditions include babies with at least one congenital anomaly with no identified genetic aetiology. Not all babies undergo genetic testing, and it is inevitable that some of these non-genetic anomalies will have an underlying genetic aetiology.
Total birth prevalence of major anomaly subgroups
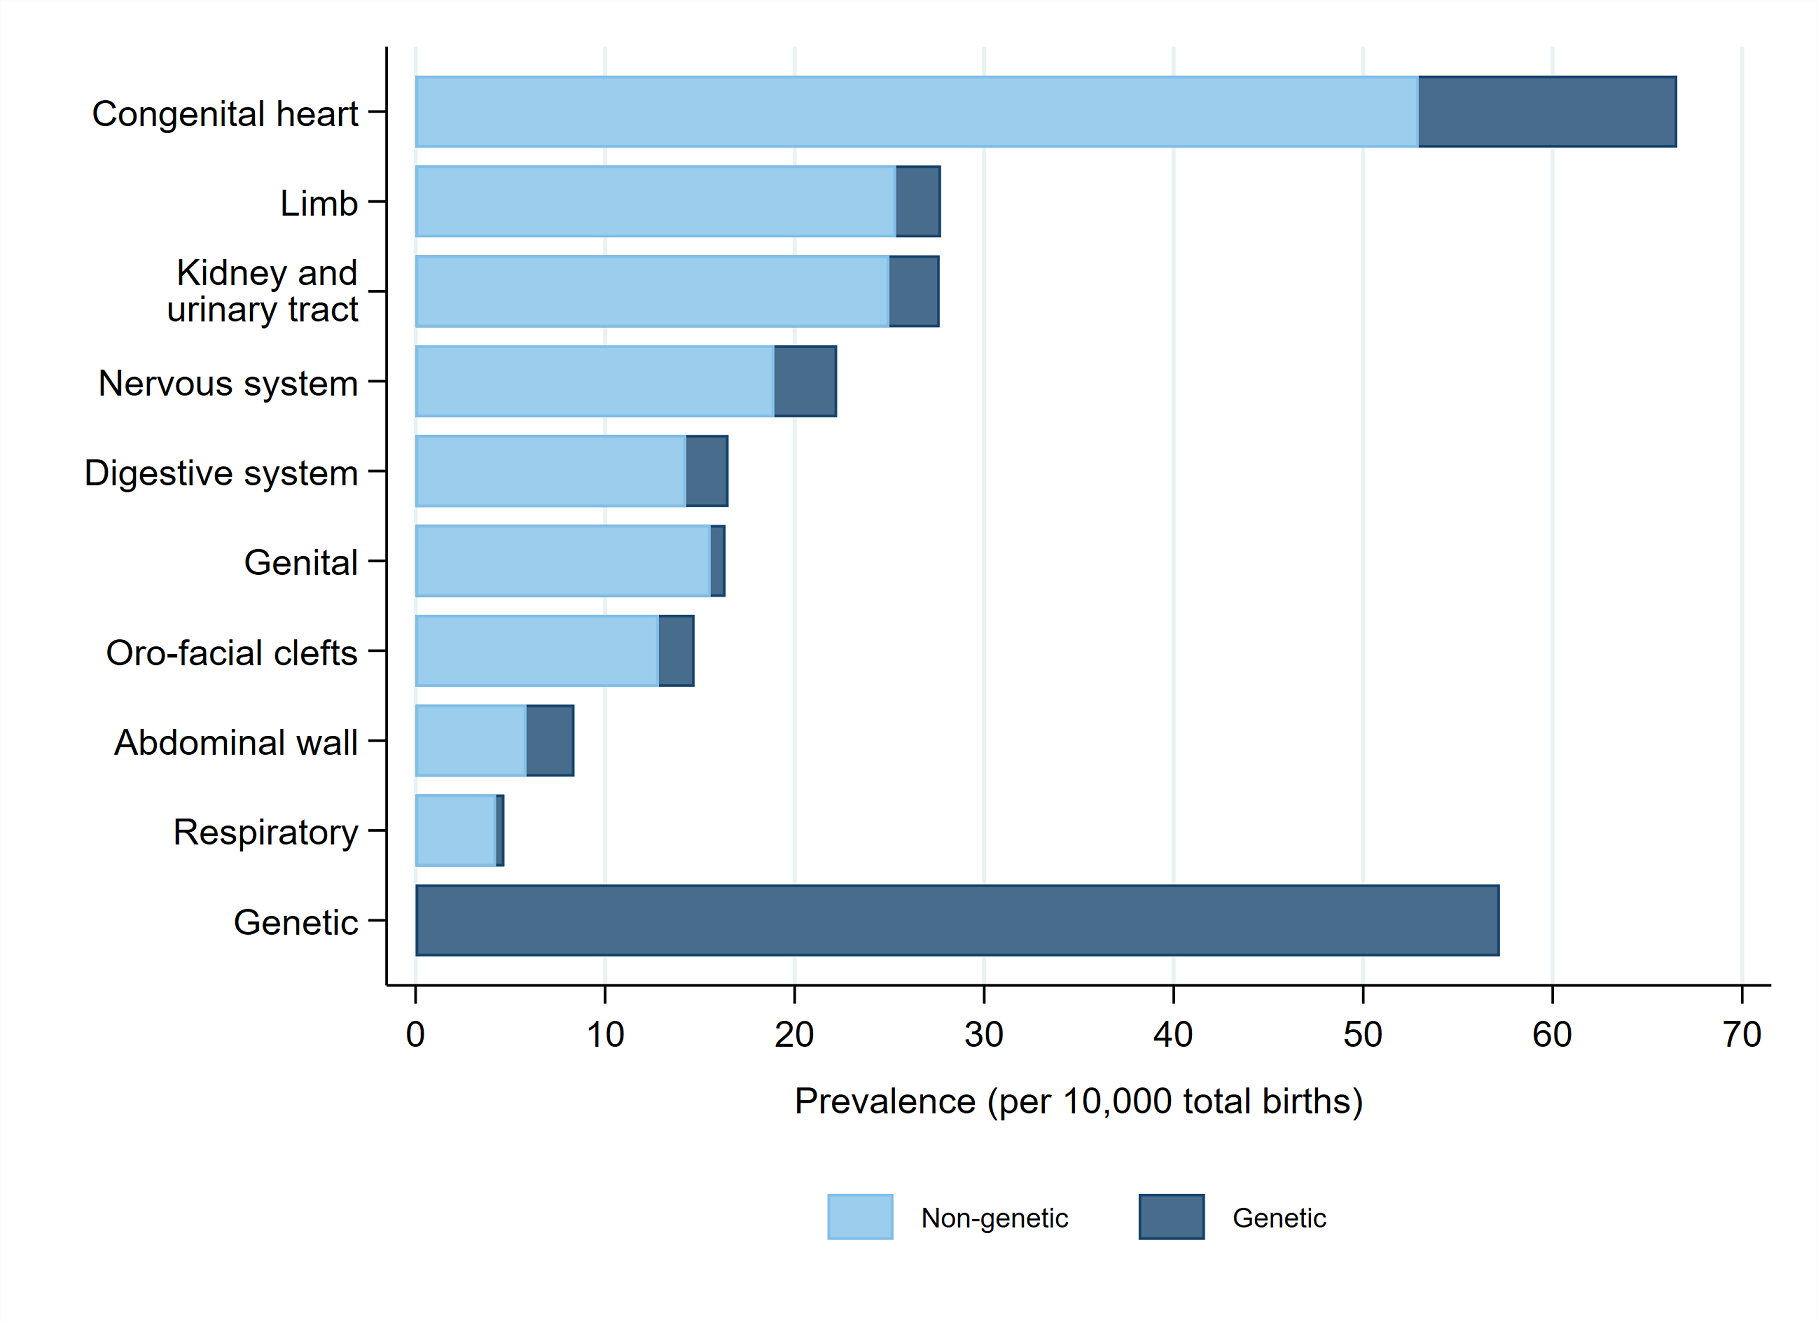
Figure 2a and Data table 1 show that the prevalence for total births in 2020 was highest in the congenital heart anomalies subgroup (66.6 per 10,000, 95% CI 64.5-68.7), followed by genetic conditions (57.2 per 10,000 total births, 95% CI 55.3-59.2), limb anomalies (27.7 per 10,000, 95% CI 26.4-29.1) and anomalies of the kidney and urinary tract (27.7 per 10,000 total births, 95% CI 26.3-29.0).
Figure 2a: Total birth prevalence: The number of babies per 10,000 total births with an anomaly in each congenital anomaly subgroup in England, 2020
Live birth prevalence by anomaly group
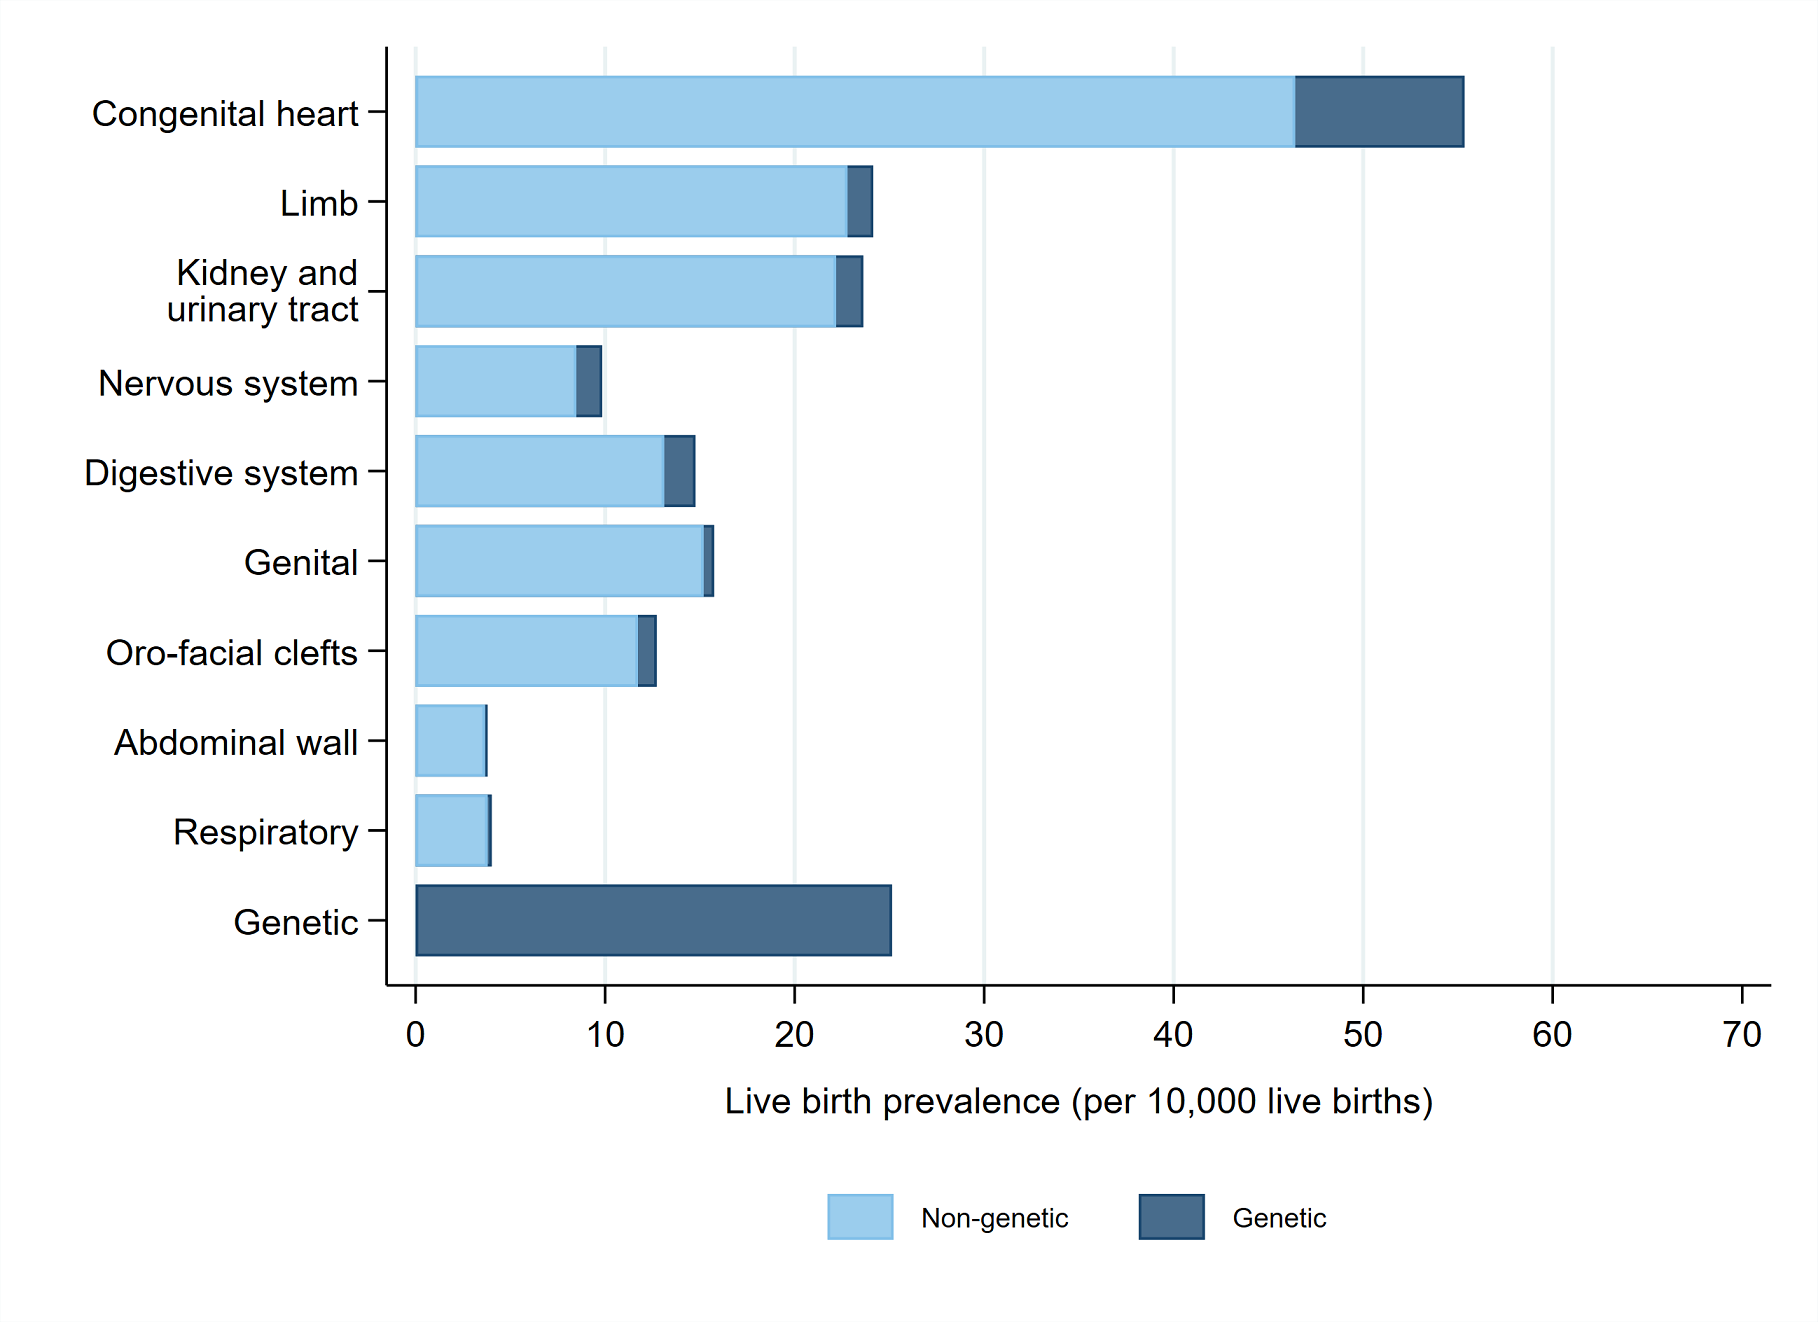
Figure 2b and Data table 1 show that the prevalence for those who are live born was also highest in congenital heart anomalies (55.3 per 10,000 live births, 95% CI 53.5-57.3), followed by the genetic conditions subgroup (25.1 per 10,000 live births, 95% CI 23.9-26.5), the limb anomalies subgroup (24.1 per 10,000 live births, 95% CI 22.9-25.4) and congenital anomalies of the kidney and urinary tract (23.6 per 10,000 live births, 95% CI 22.4-24.9).
The pattern for all babies diagnosed with a congenital anomaly, and those that are live born, is similar for most subgroups apart from genetic and nervous system anomalies. The lower live born prevalence in these two groups reflects the severity of some of the conditions in these subgroups.
Figure 2b: Live birth prevalence: The number of babies born alive per 10,000 live births with an anomaly in each congenital anomaly subgroup in England, 2020
Last edited: 1 December 2022 10:17 am