Publication, Part of NCARDRS Congenital Anomaly Statistics: Annual Data
NCARDRS Congenital Anomaly Official Statistics Report, 2020
Official statistics
4.1 Important public health indicators: Perinatal and infant mortality
Perinatal mortality refers to stillbirths and deaths under 7 days of age (relative to all total births in 2020) and infant mortality is defined as deaths under one year of age (relative to all live births in 2020). Data table 10 shows that the rate of perinatal mortality in babies with any reported fetal anomaly was 7.6 per 10,000 births. There were 548 infant deaths among babies with one or more congenital anomalies in the 587,222 live births in 2020, giving an infant mortality rate of 9.3 per 10,000 live births.
Child and infant mortality data from the ONS for 2020 shows that congenital anomalies were the most common cause of death in the post-neonatal period, accounting for 36.3% of deaths. Congenital anomalies were also listed as the cause of 31.4% of infant deaths and 22.7% of perinatal deaths, the second highest cause in both categories after prematurity. While the data within this report should be viewed in a wider context of perinatal and infant mortality, congenital anomalies, particularly congenital heart, genetic and digestive system anomalies, are a common factor in infant and perinatal deaths.
The data presented here should be viewed with some caution, as babies with more than one anomaly will appear in each anomaly subgroup. Additionally, a link between the presence of a congenital anomaly and the cause of death has not been established, therefore it is possible that the identified congenital anomaly had no bearing on mortality. These figures also do not include conditions with a high level of antenatal mortality, pregnancy loss or rate of terminations, where few pregnancies result in either a live birth or stillbirth- for example, anencephaly.
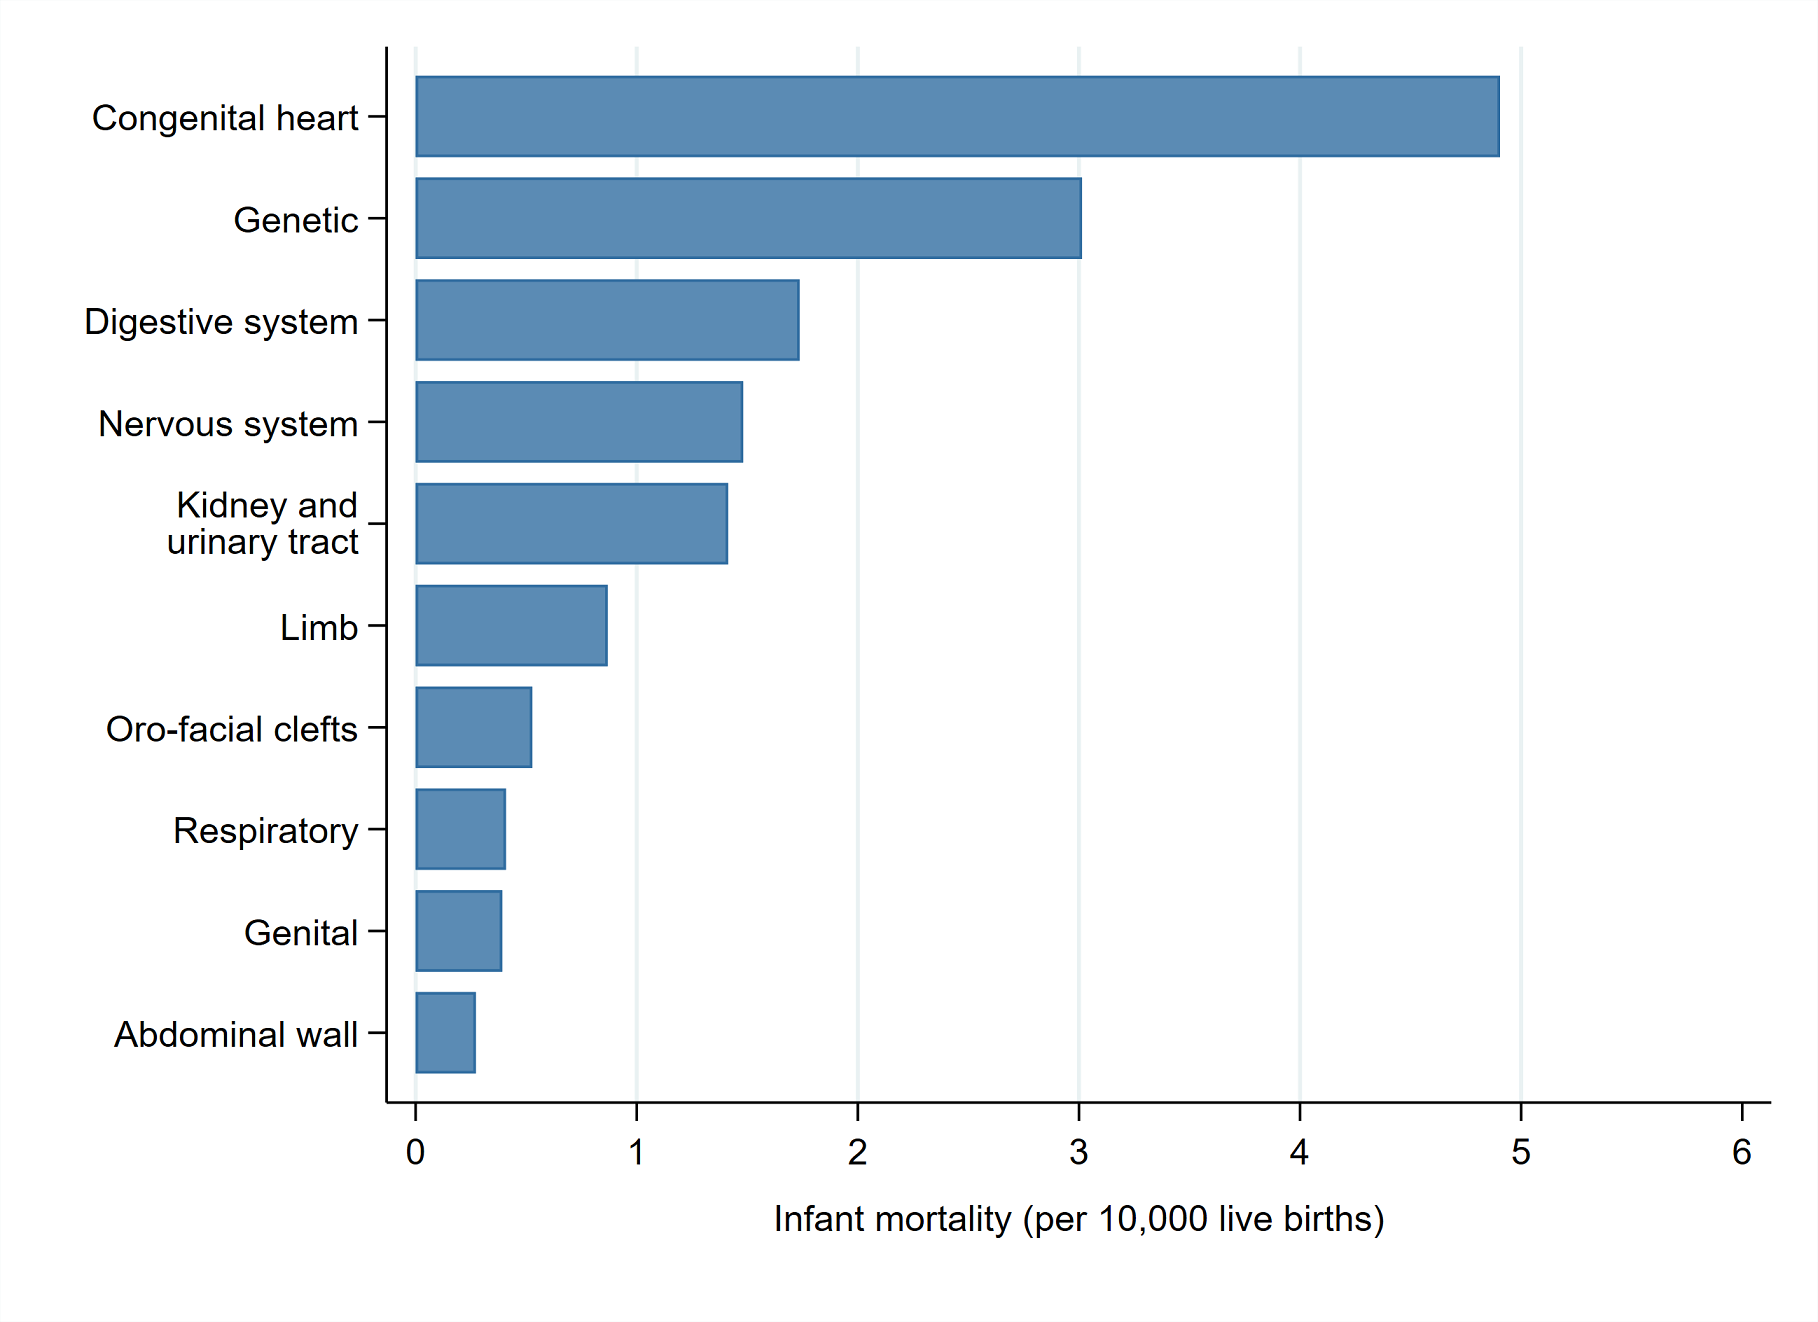
Figures 9a and 9b show that in cases of both perinatal and infant mortality, the most frequently recorded anomalies were similar, although ordered differently. The rate of perinatal mortality associated with congenital anomalies was highest for genetic disorders (3.1 per 10,000 total births, 95% CI 2.7-3.6), followed by congenital heart anomalies (2.8 per 10,000 total births, 95% CI 2.4-3.2). These were reversed when looking at rate of infant mortality (Figure 9b and Data table 10), which was highest for congenital heart anomalies (4.9 per 10,000 live births, 95% CI 4.4-5.5), followed by genetic disorders (3.0 per 10,000 live births, 95% CI 2.6-3.5).
Figure 9a: Perinatal mortality (stillbirths and deaths under 7 days of age) rate (per 10,000 total births) by congenital anomaly subgroup in England, 2020
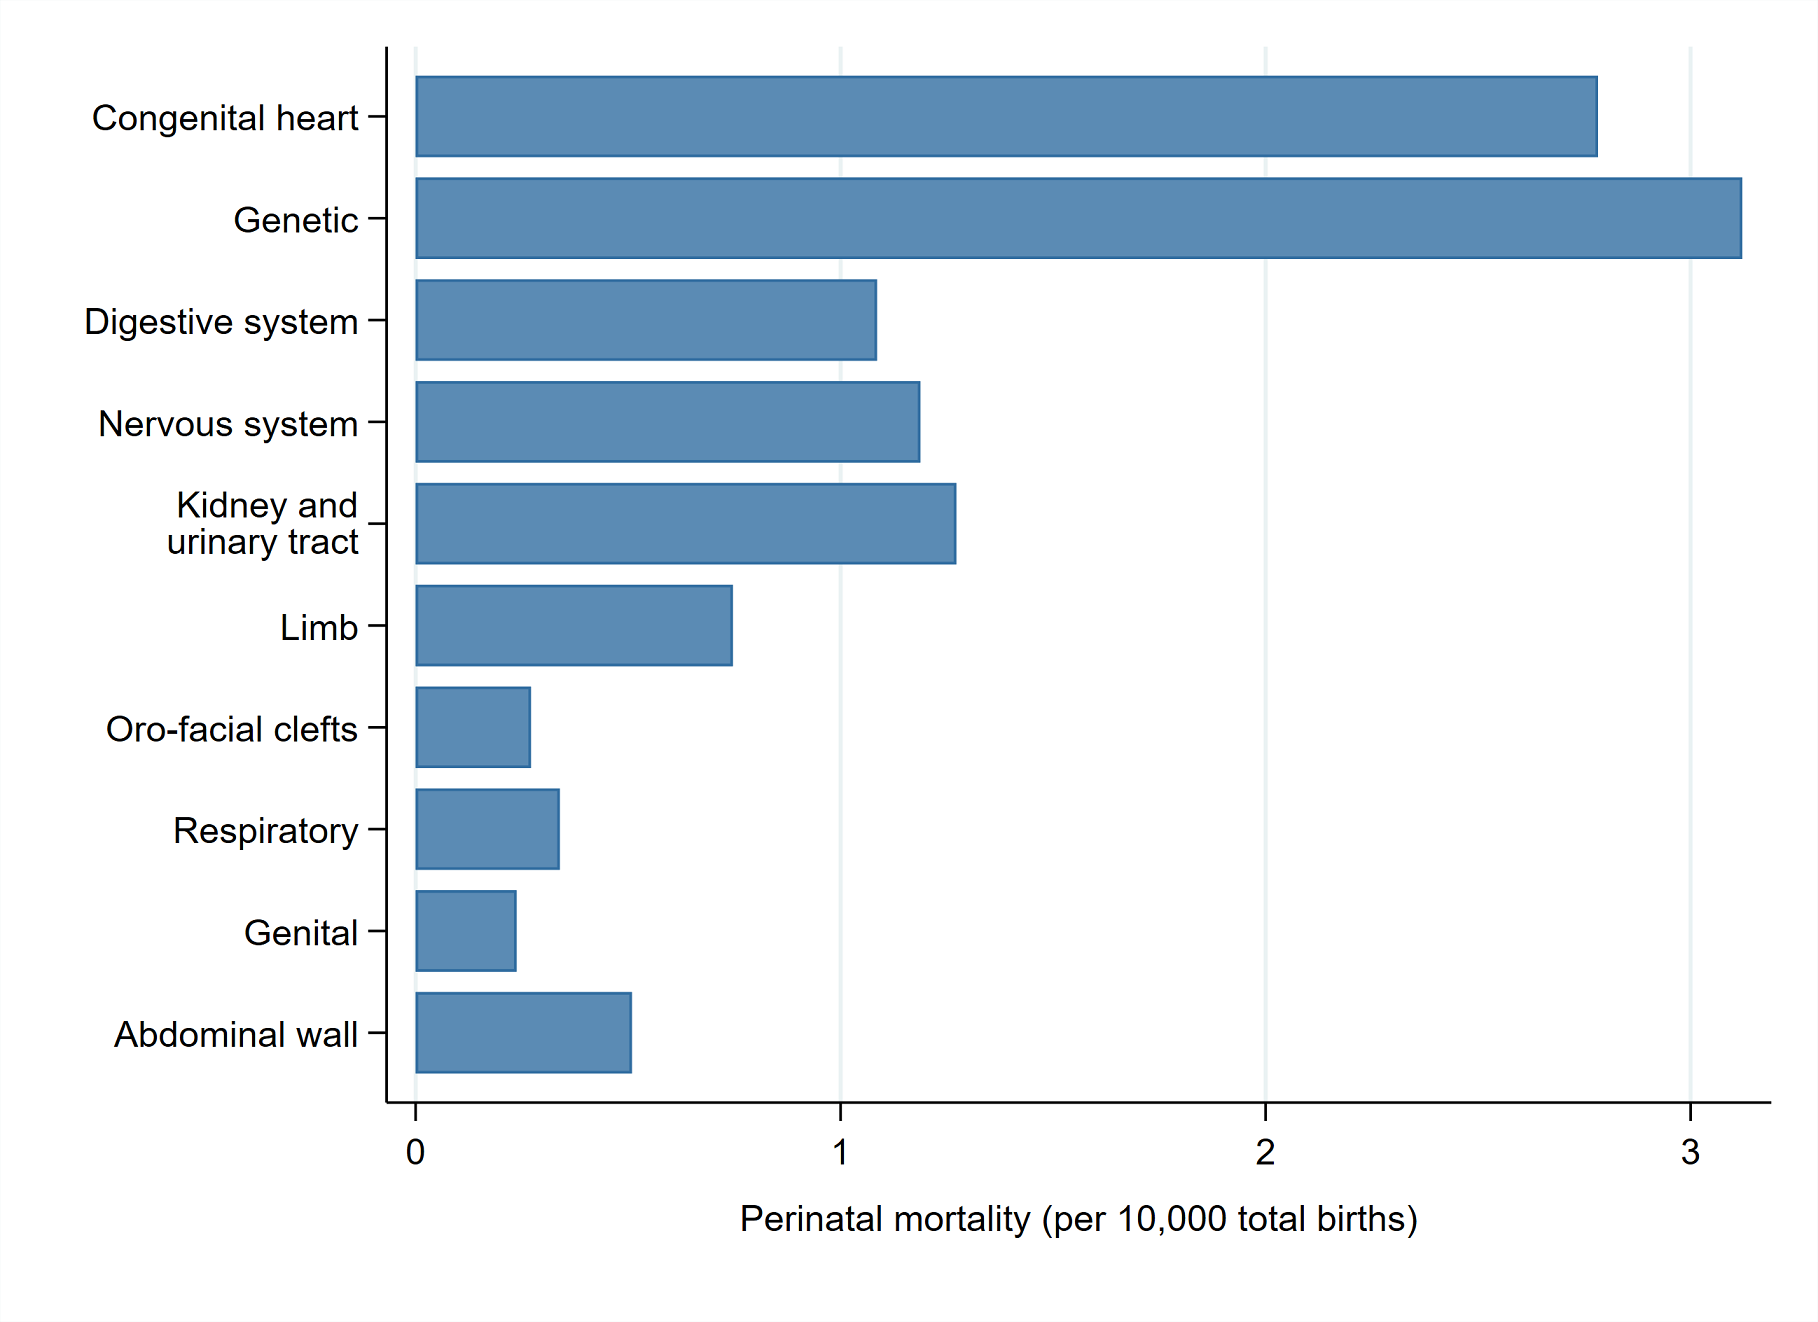
Figure 9b: Infant mortality (deaths under one year of age) rate (per 10,000 live births) by congenital anomaly subgroup in England, 2020
Last edited: 1 December 2022 10:17 am