Publication, Part of NCARDRS Congenital Anomaly Statistics: Annual Data
NCARDRS Congenital Anomaly Official Statistics Report, 2020
Official statistics
4.2 Important public health indicators: Maternal age
Data table 11 shows that the birth prevalence of babies with any congenital anomaly was significantly higher in babies born to mothers aged 35 to 39 years (252.6 per 10,000 total births, 95% CI 243.5-262.0) and to those 40 years and over (400.7 per 10,000 total births, 95% CI 377.8-424.6), as highlighted by the non-overlapping confidence intervals. Babies born to mothers under 20 years had a statistically significant higher rate of congenital anomalies (236.8 per 10,000 total births, 95% CI 212.8-262.6) compared to those born to mothers aged between 30 and 34 years (196.9 per 10,000 total births, 95% CI 190.8-203.2). The birth prevalence of all anomalies was similar in babies born to mothers aged between 30 and 34 years at delivery and in babies born to mothers aged between 25 and 29 years (202.7 per 10,000 total births, 95% CI 195.8-209.9).
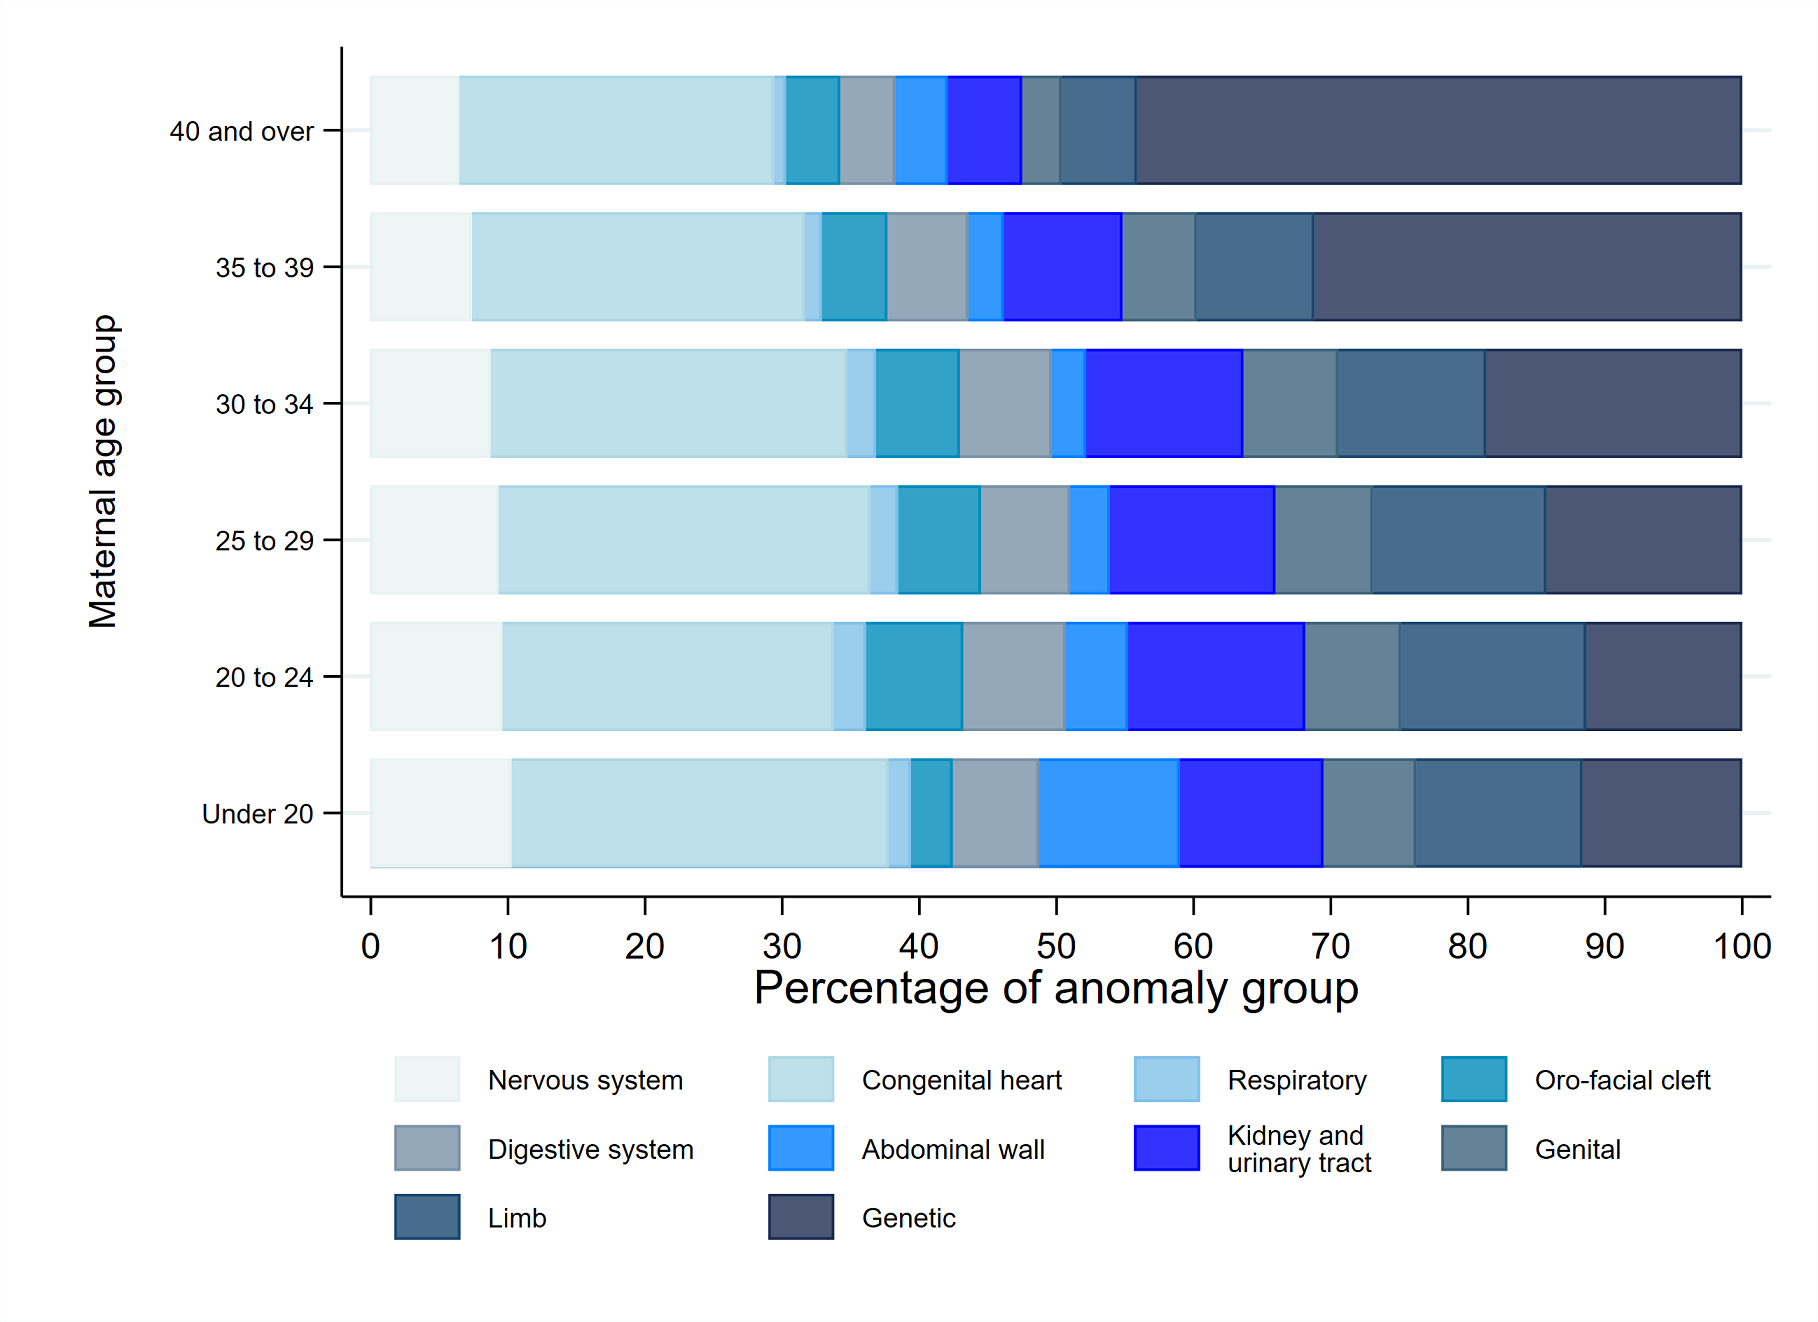
Figure 10 illustrates that genetic conditions were present in a higher proportion of children born to mothers aged 40 and over compared to all other age groups. The rate of genetic anomalies in babies born to mothers over 40 years (230.4 per 10,000 total births, 95% CI 213.2-248.7, n=656) was almost 7 times higher relative to babies born to mothers under 20 years (33.2 per 10,000 total births, 95% CI 24.6-43.7, n=50); this difference in risk is statistically significant, with a risk ratio equal to 6.9 (95% CI 5.2-9.2) between the two maternal age groups.
Data table 12 reports that the rate of non-genetic anomalies in babies born to mothers aged under 20 years of age at birth of the child (203.6 per 10,000 total births, 95% CI 181.5-227.7) is significantly higher than the rate in mothers between 25 to 39 years (169.8 per 10,000 total births, 95% CI 163.4-176.3), but no significant difference is found with mothers aged 40 and above (170.3 per 10,000 total births, 95% CI 155.5-186.1). As reported in Data table 11, the high rate of non-genetic anomalies in babies born to mothers under 20 years is primarily driven by the significantly higher prevalence of abdominal wall anomalies in women within this age group (27.9 per 10,000 total births, 95% CI 20.1-37.6) compared to the other maternal age groups.
Figure 10: Congenital anomaly group by maternal age (percentage values) in England, 2020
Last edited: 1 December 2022 10:17 am