Publication, Part of Health Survey for England
Health Survey for England, 2024
Official statistics, National statistics, Survey, Accredited official statistics
Children’s health and health-related behaviours
Summary
This report presents key statistics about children’s health and health-related behaviours in 2024. It describes children’s cigarette smoking, e-cigarette use, experience of drinking alcohol, and general health.
Key findings
- The proportion of children who had ever tried a cigarette decreased from 19% in 1997 to 2% in 2024.
- In 2024, 9% of children aged 8 to 15 had ever used an electronic cigarette or vaping device.
- 16% of children aged 8 to 15 reported ever having had a proper alcoholic drink in 2024.
- The proportion of children who reported ever having an alcoholic drink was higher among those whose mother (23%) or father (26%) consumed alcohol at an increased or higher risk level than among those whose mother (6%) or father (7%) had not drunk alcohol in the past year.
Children's cigarette smoking
Introduction
Children and young smokers experience more risks to their respiratory health (Source: Action on Smoking and Health (ASH, 2015)). Those who begin smoking during childhood are more likely to continue smoking into adulthood (Source: Chen and Millar, 1998).
In 2023, following a government consultation (Source: Department for Health and Social Care) the Prime Minister announced plans to promote a better future for children and young people in relation to their perceptions and use of cigarettes, e-cigarettes, and other vaping devices. The government aims to introduce a law to prevent children turning 15 in 2024 from legally being sold cigarettes in their lifetime (Source: Department of Health and Social Care).
Methods and definitions
Children aged 8 to 15 were asked about their experiences of cigarette smoking within a self-completion questionnaire, ensuring confidentiality from other household members, in particular parents and caregivers.
Children’s experiences of cigarette smoking were captured using two questions. Children were asked: ‘Have you ever tried smoking a cigarette, even if it was only a puff or two?’ followed by a choice of six statements which measured frequency of cigarette smoking:
- I have never smoked a cigarette
- I have only smoked a cigarette once or twice
- I used to smoke sometimes, but I never smoke a cigarette now
- I sometimes smoke cigarettes, but I don’t smoke every week
- I smoke between one and six cigarettes a week
- I smoke more than six cigarettes a week
Children were counted as having smoked a cigarette if they selected any option other than ‘I have never smoked a cigarette’.
Within this report, year on year trends are discussed where data is comparable.
Parents were defined as current smokers if they answered ‘yes’ to the question ‘do you smoke cigarettes at all nowadays?’. They were defined as former regular smokers if they answered ‘yes’ to the question ‘have you ever smoked cigarettes?’ and also confirmed that they had smoked cigarettes regularly, at least once a day. Parents were classified as having never regularly smoked if they had either never smoked or had not smoked at least one cigarette a day.
Note that for some of the analysis undertaken the number of children in each group was very small. This limits the ability to detect differences between subgroups and makes it difficult to determine whether any observed differences were real or due to chance.
Children's self-reported cigarette smoking status, by survey year, age and sex
In 2024, 2% of children aged 8 to 15 reported that they had ever smoked a cigarette. Survey estimates are subject to a margin of error. It is likely the proportion of children in the population who have ever smoked is between 1.1% and 4.0%.
The proportion of children aged 8 to 15 who had ever smoked a cigarette decreased from 19% in 1997 to 2% in 2024.
Cigarette smoking status varied by age, with 5% of children aged 13 to 15 reporting ever having smoked a cigarette compared with less than 1% of children aged 8 to 12.
There was no difference in the proportion of boys and girls who had ever smoked a cigarette (2%).
For more information: Table 1 and Table A1
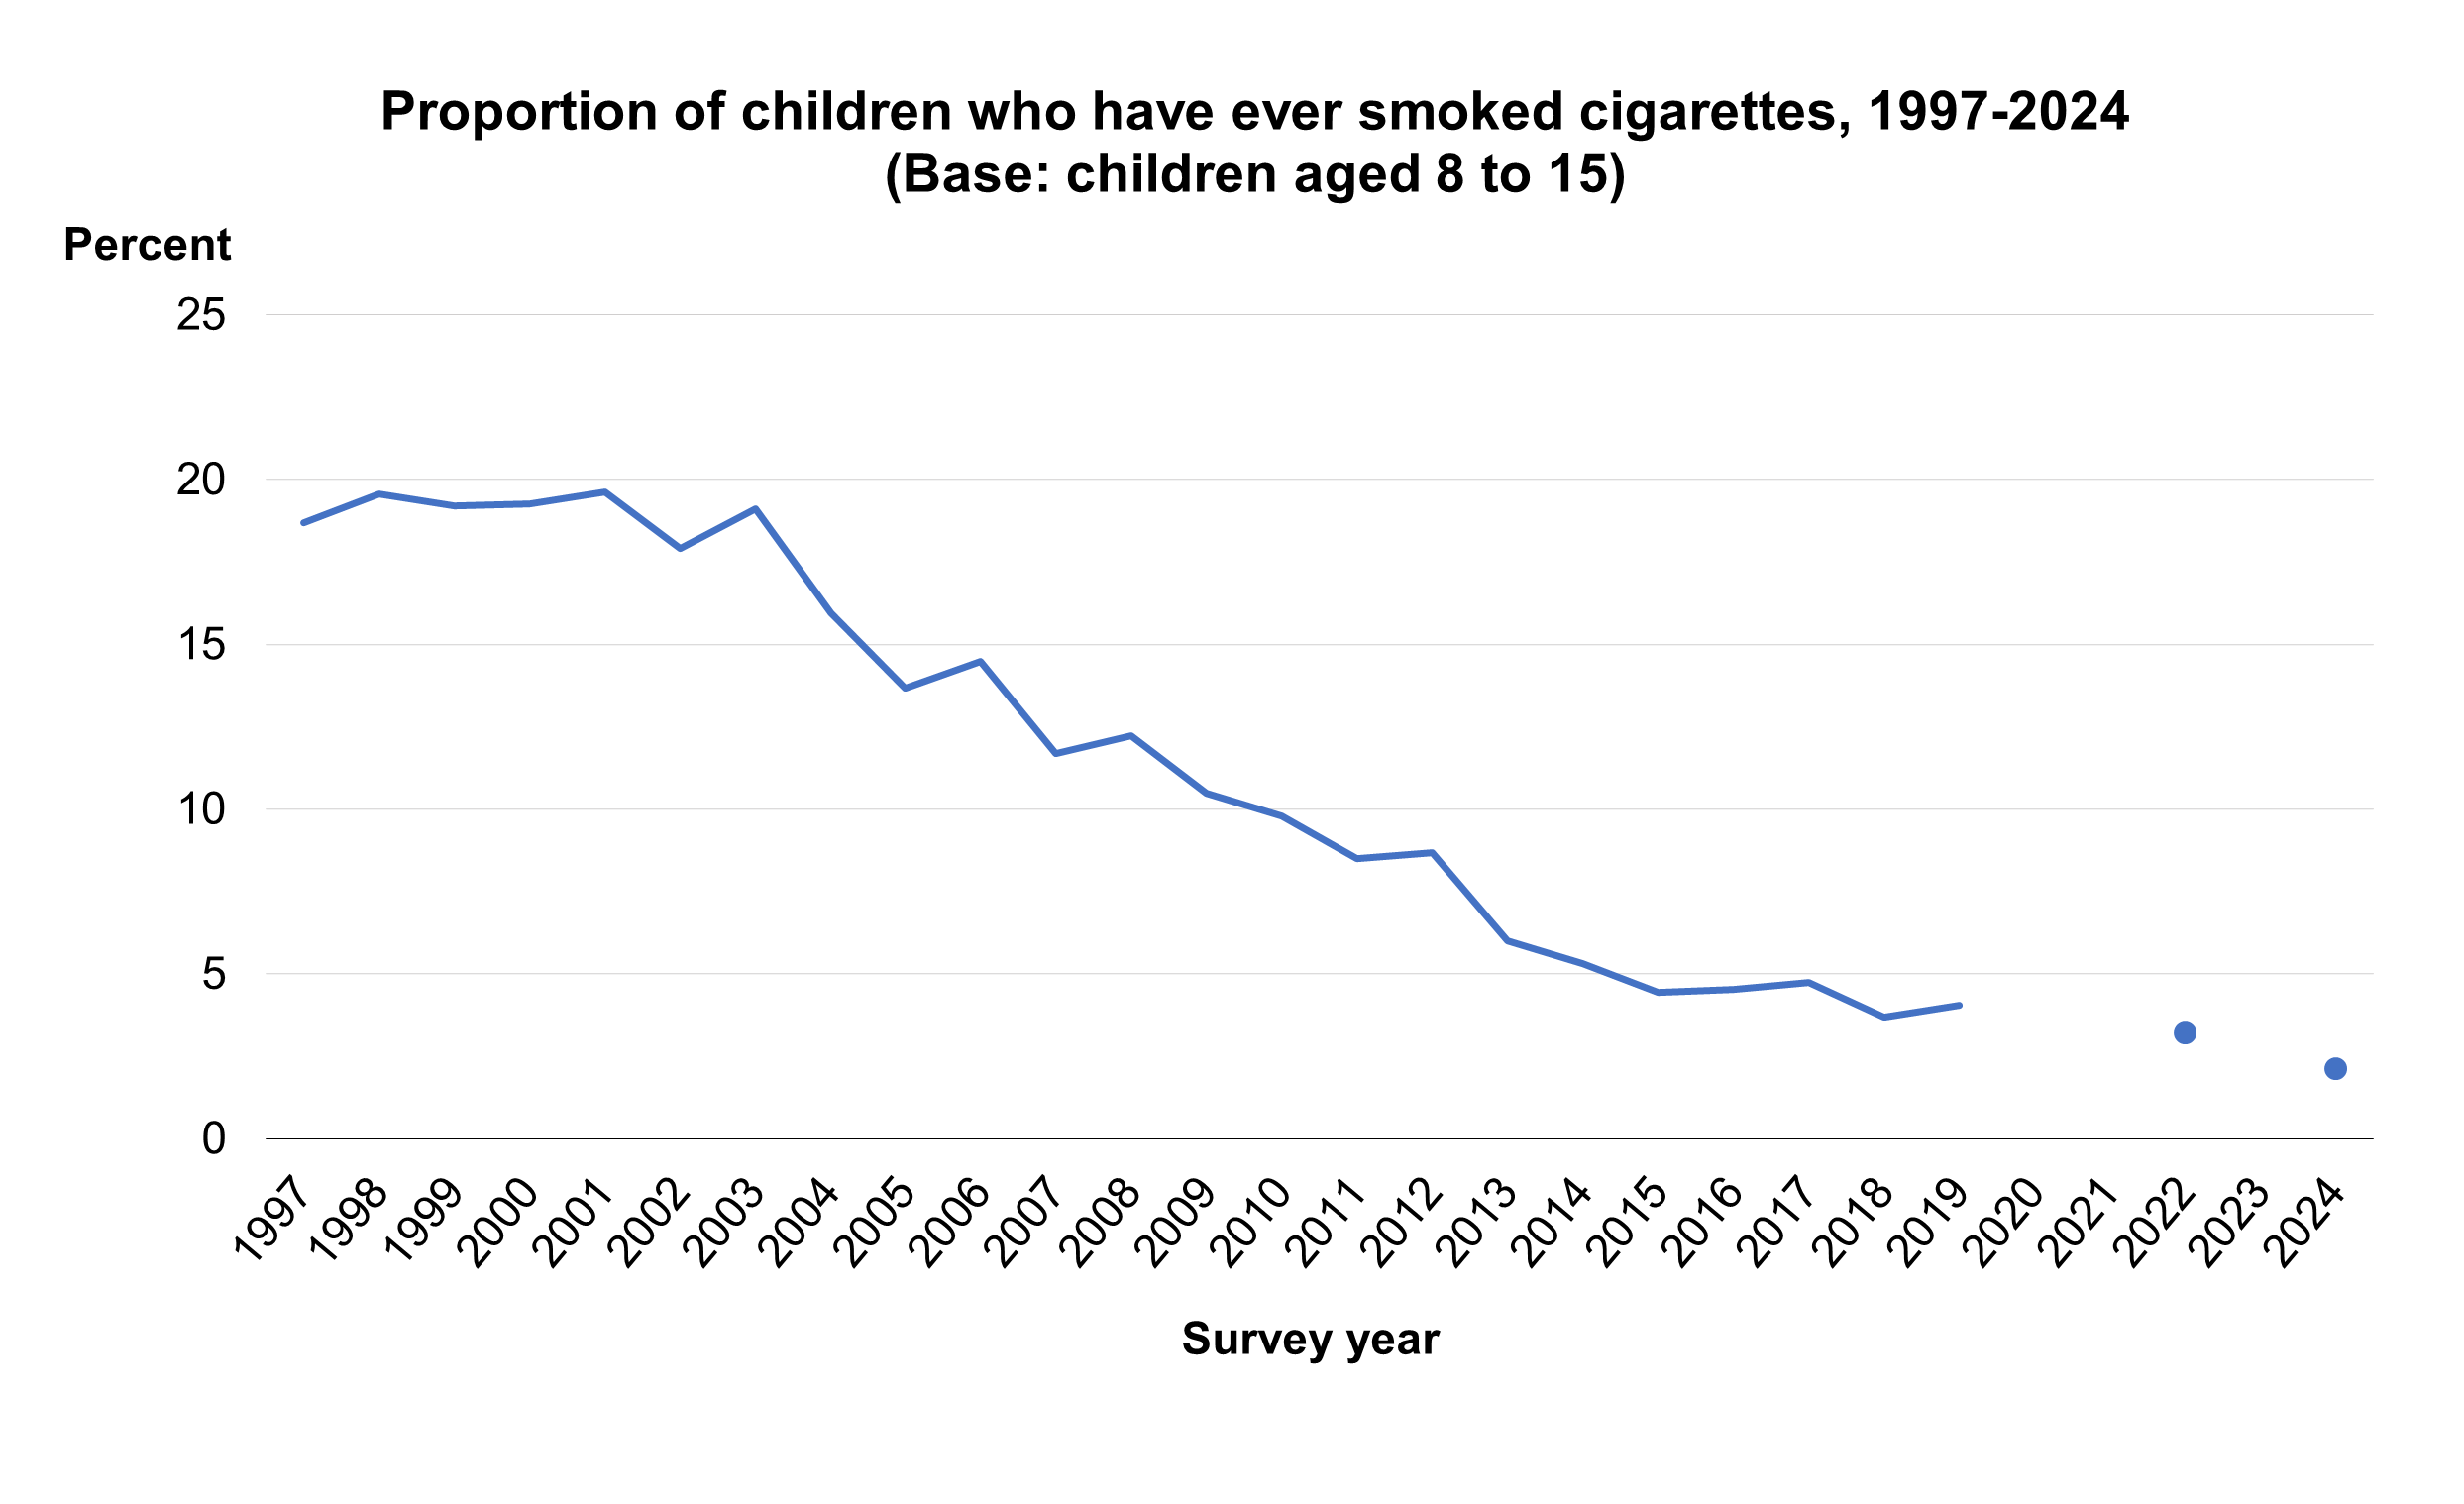
HSE data collection was paused in 2020 due to pandemic-related restrictions, meaning that insufficient data was collected for reporting. Numbers of child interviews in 2021 were also too low to be reported on. There was no annual survey in 2023.
Children's cigarette smoking status, by area deprivation and sex
There was no statistically significant association between the proportion of children reporting ever having smoked a cigarette and area deprivation.
For more information: Table 2
Children's smoking status, by parents' smoking status
Evidence suggests that parental smoking status is one of the main risk factors linked with smoking initiation among children. Children who live in a household where one or both parents currently smoke are more likely to try smoking or become smokers themselves (Source: ASH, 2024).
To establish the current smoking status of children’s parents or guardians, data for adults who took part in the HSE interview was linked to their children’s records if they were the legal parent or guardian of the child and lived in the same household.
Children aged 8 to 15 reporting that they had ever smoked a cigarette varied according to their mother’s smoking status. The proportion of children reporting ever having smoked was highest among those whose mother currently smoked cigarettes (13%) and lowest among those whose mother had never smoked cigarettes regularly (<1%).
No statistically significant association was found between whether children had ever smoked a cigarette and their father’s smoking status.
For more information: Table 3 and Table 4
Children's e-cigarette use
Introduction
Electronic cigarettes (e-cigarettes) and other vaping devices use a range of methods that allow their users to inhale nicotine as a vapour rather than via tobacco smoke. Recent research by Action on Smoking and Health (ASH) found that 20% of young people in Great Britain aged 11 to 17 had ever tried vaping (ASH, 2025).
There are strict regulations on the kind of e-cigarettes and vaping devices that can be sold, and how much nicotine they can contain (source: GOV.UK). It is an offence to sell e-cigarettes to children under 18 in the United Kingdom.
Methods and definitions
This report uses the term e-cigarette to refer to all vaping devices.
As with cigarettes, children aged 8 to 15 were asked about their experiences of e-cigarettes within a self-completion questionnaire, ensuring confidentiality from other members of the household, in particular parents and caregivers. Children have been asked about their use of e-cigarettes since 2015.
Children’s experience of e-cigarettes was captured through two questions. Children were initially asked ‘have you ever heard of e-cigarettes or vaping devices?’. If the child answered yes, they were offered a choice of six statements which measured the child’s personal use of e-cigarettes. Statements included:
- I have never tried e-cigarettes or vaping devices
- I have used vaping devices only once or twice
- I used to use e-cigarettes or vaping devices but I don’t now
- I sometimes use e-cigarettes or vaping devices but don’t use them every week
- I use e-cigarettes or vaping devices regularly, once a week or more
Children who selected any statement other than ‘I have never tried e-cigarettes or vaping devices’ at the second question were classified as having used an e-cigarette. In 2024, children who said they had never heard of e-cigarettes or vaping devices at the initial question were classified as having never used an e-cigarette or vaping device. This is different to previous years and figures in this report cannot be compared with figures presented in previous HSE reports. Instead, trend figures published in the 2024 report should be used for any comparisons over time.
Note that for some of the analysis undertaken the number of children in each group was very small. This limits the ability to detect differences between subgroups and makes it difficult to determine whether any observed differences were real or due to chance.
Children's e-cigarette and vaping device use, by survey year, age and sex
The proportion of children aged 8 to 15 who had ever used an e-cigarette ranged from 6% to 9% over the period 2016 to 2024. In 2024, 9% of children reported having ever used an e-cigarette or vaping device. Note that the confidence interval around this estimate is wide, and, within the wider population, the proportion of children aged 8 to 15 who had ever used an e-cigarette is likely to be between 6.7% and 13.0%.
E-cigarette use was similar among boys (10%) and girls (9%).
E-cigarette use varied by age, with 19% of children aged 13 to 15 ever having used e-cigarettes compared with 2% of children aged 8 to 12. Within the wider population, the proportion of children aged 13 to 15 who had ever used an e-cigarette is likely to be between 13.4% and 26.1%.
For more information: Table 5
Children’s e-cigarette and vaping device use, by cigarette smoking status
Among children aged 8 to 15 who had never smoked a cigarette, 8% reported using e-cigarettes or vaping devices.
For more information: Table 6
Children’s e-cigarette and vaping device use, by area deprivation
Children’s e-cigarette use did not differ by area deprivation.
For more information: Table 7
Saliva cotinine levels in children
Introduction
Cotinine, a metabolite of nicotine, provides an indicator of recent exposure to tobacco or its smoke. Cotinine is generally considered the most useful of the various biological markers that are indicators of smoking.
Methods and definitions
Saliva samples were taken from children aged 4 to 15 during the nurse visit and were analysed for cotinine. The measurement of cotinine in the HSE provides an objective check on self-reported smoking behaviour. When analysed in a specialist laboratory, as is done for HSE, low levels are also a sensitive marker of exposure to other people’s smoke. Cotinine has a half-life in the body of between 16-20 hours, so it will detect regular smoking but may not detect occasional smoking if the last occasion was several days ago. Sources of cotinine other than tobacco can for practical purposes be ignored.
Saliva cotinine levels for HSE were measured using a very sensitive method. For this report, geometric means have been calculated as the distribution of saliva cotinine levels in non-smokers is very skewed, as so many have no detectable cotinine; geometric means take less account of extreme values that might distort the average or mean.
Saliva cotinine levels of cotinine-validated non-smokers aged 4 to 15, by age
28% of non-smoking children aged 4 to 15 had detectable saliva cotinine levels. The geometric mean saliva cotinine level was 0.08.
Saliva cotinine levels with detectable cotinine were similar across age groups.
For more information: Table 8
Children's experience of alcohol
Introduction
In 2009, the Chief Medical Officer published guidance on the consumption of alcohol by children and young people which outlined recommendations for children to remain alcohol free up to the age of 15, and that consumption in young adults aged 15 to 17 be supervised by an adult (Source: Department of Health, 2009). The guidance is based on the understanding that alcohol consumption at any point during childhood is known to have adverse effects on development and a wide range of health and social problems.
Following on from this, the 2012 Alcohol Strategy identified a key outcome to achieve ‘a sustained reduction in both the numbers of 11 to 15 year olds drinking alcohol and the amounts consumed’ (Source: HM Government, 2012).
Methods and definitions
Children aged 8 to 15 were asked questions about their experiences of alcohol as part of the self-completion survey. This allowed the child to record their responses confidentially.;
Children were asked ‘have you ever had a proper alcoholic drink – a whole drink, not just a sip?’. This was followed by a further question, added in 1999: ‘have you ever drunk alcopops (such as Bacardi Breezer, Smirnoff Ice, WKD etc)?’. Children are classified as having drunk alcohol if they answered ‘yes’ to either question.
To establish usual weekly alcohol consumption of children’s parents or guardians, data for adults who took part in the HSE interview was linked to their children’s records if they were the legal parent or guardian of the child and lived in the same household. Parents’ usual weekly alcohol consumption was estimated by recording in detail what they had drunk on an average day when they drank in the past 12 months and multiplying that by how often they reported that they drank alcohol. They were classified into four groups in line with the current guidelines for sensible drinking:
- non-drinkers (who reported that they had not drunk alcohol in the past 12 months)
- ‘lower risk’ (weekly consumption of up to 14 units for men and women)
- ‘increasing risk’ (weekly consumption above 14 and up to 50 units for men, above 14 and up to 35 units for women)
- ‘higher risk’ (weekly consumption above 50 units a week for men, above 35 units for women)
For information about how alcohol units were calculated, see the HSE 2024 report on Adults’ health-related behaviours.
Trends are discussed between 1999 and 2024; data from previous years are not comparable.
Note that for some of the analysis undertaken, the number of children in each group was very small. This limits the ability to detect differences between subgroups and makes it difficult to determine whether any observed differences were real or due to chance.
Experience of alcohol, by survey year, age and sex
In 2024, 16% of children aged 8 to 15 reported ever having had a proper alcoholic drink, that is, a whole drink, not just a sip. Survey estimates are subject to a margin of error. It is likely the proportion of children aged 8 to 15 in the population who have ever had an alcoholic drink was between 12.9% and 20.3%.
The proportion of children who had ever drunk alcohol decreased from a peak of 45% in 2003 to 16% in 2015. It has varied between 14% and 16% since.
Similar proportions of boys and girls reported ever having drunk alcohol (17% among boys and 15% among girls).
Older children were more likely than younger children to report ever having an alcoholic drink. The proportion who did so increased from 3% of children aged 8 to 10 to 33% of children aged 13 to 15.
For more information: Table 9 and Table A2
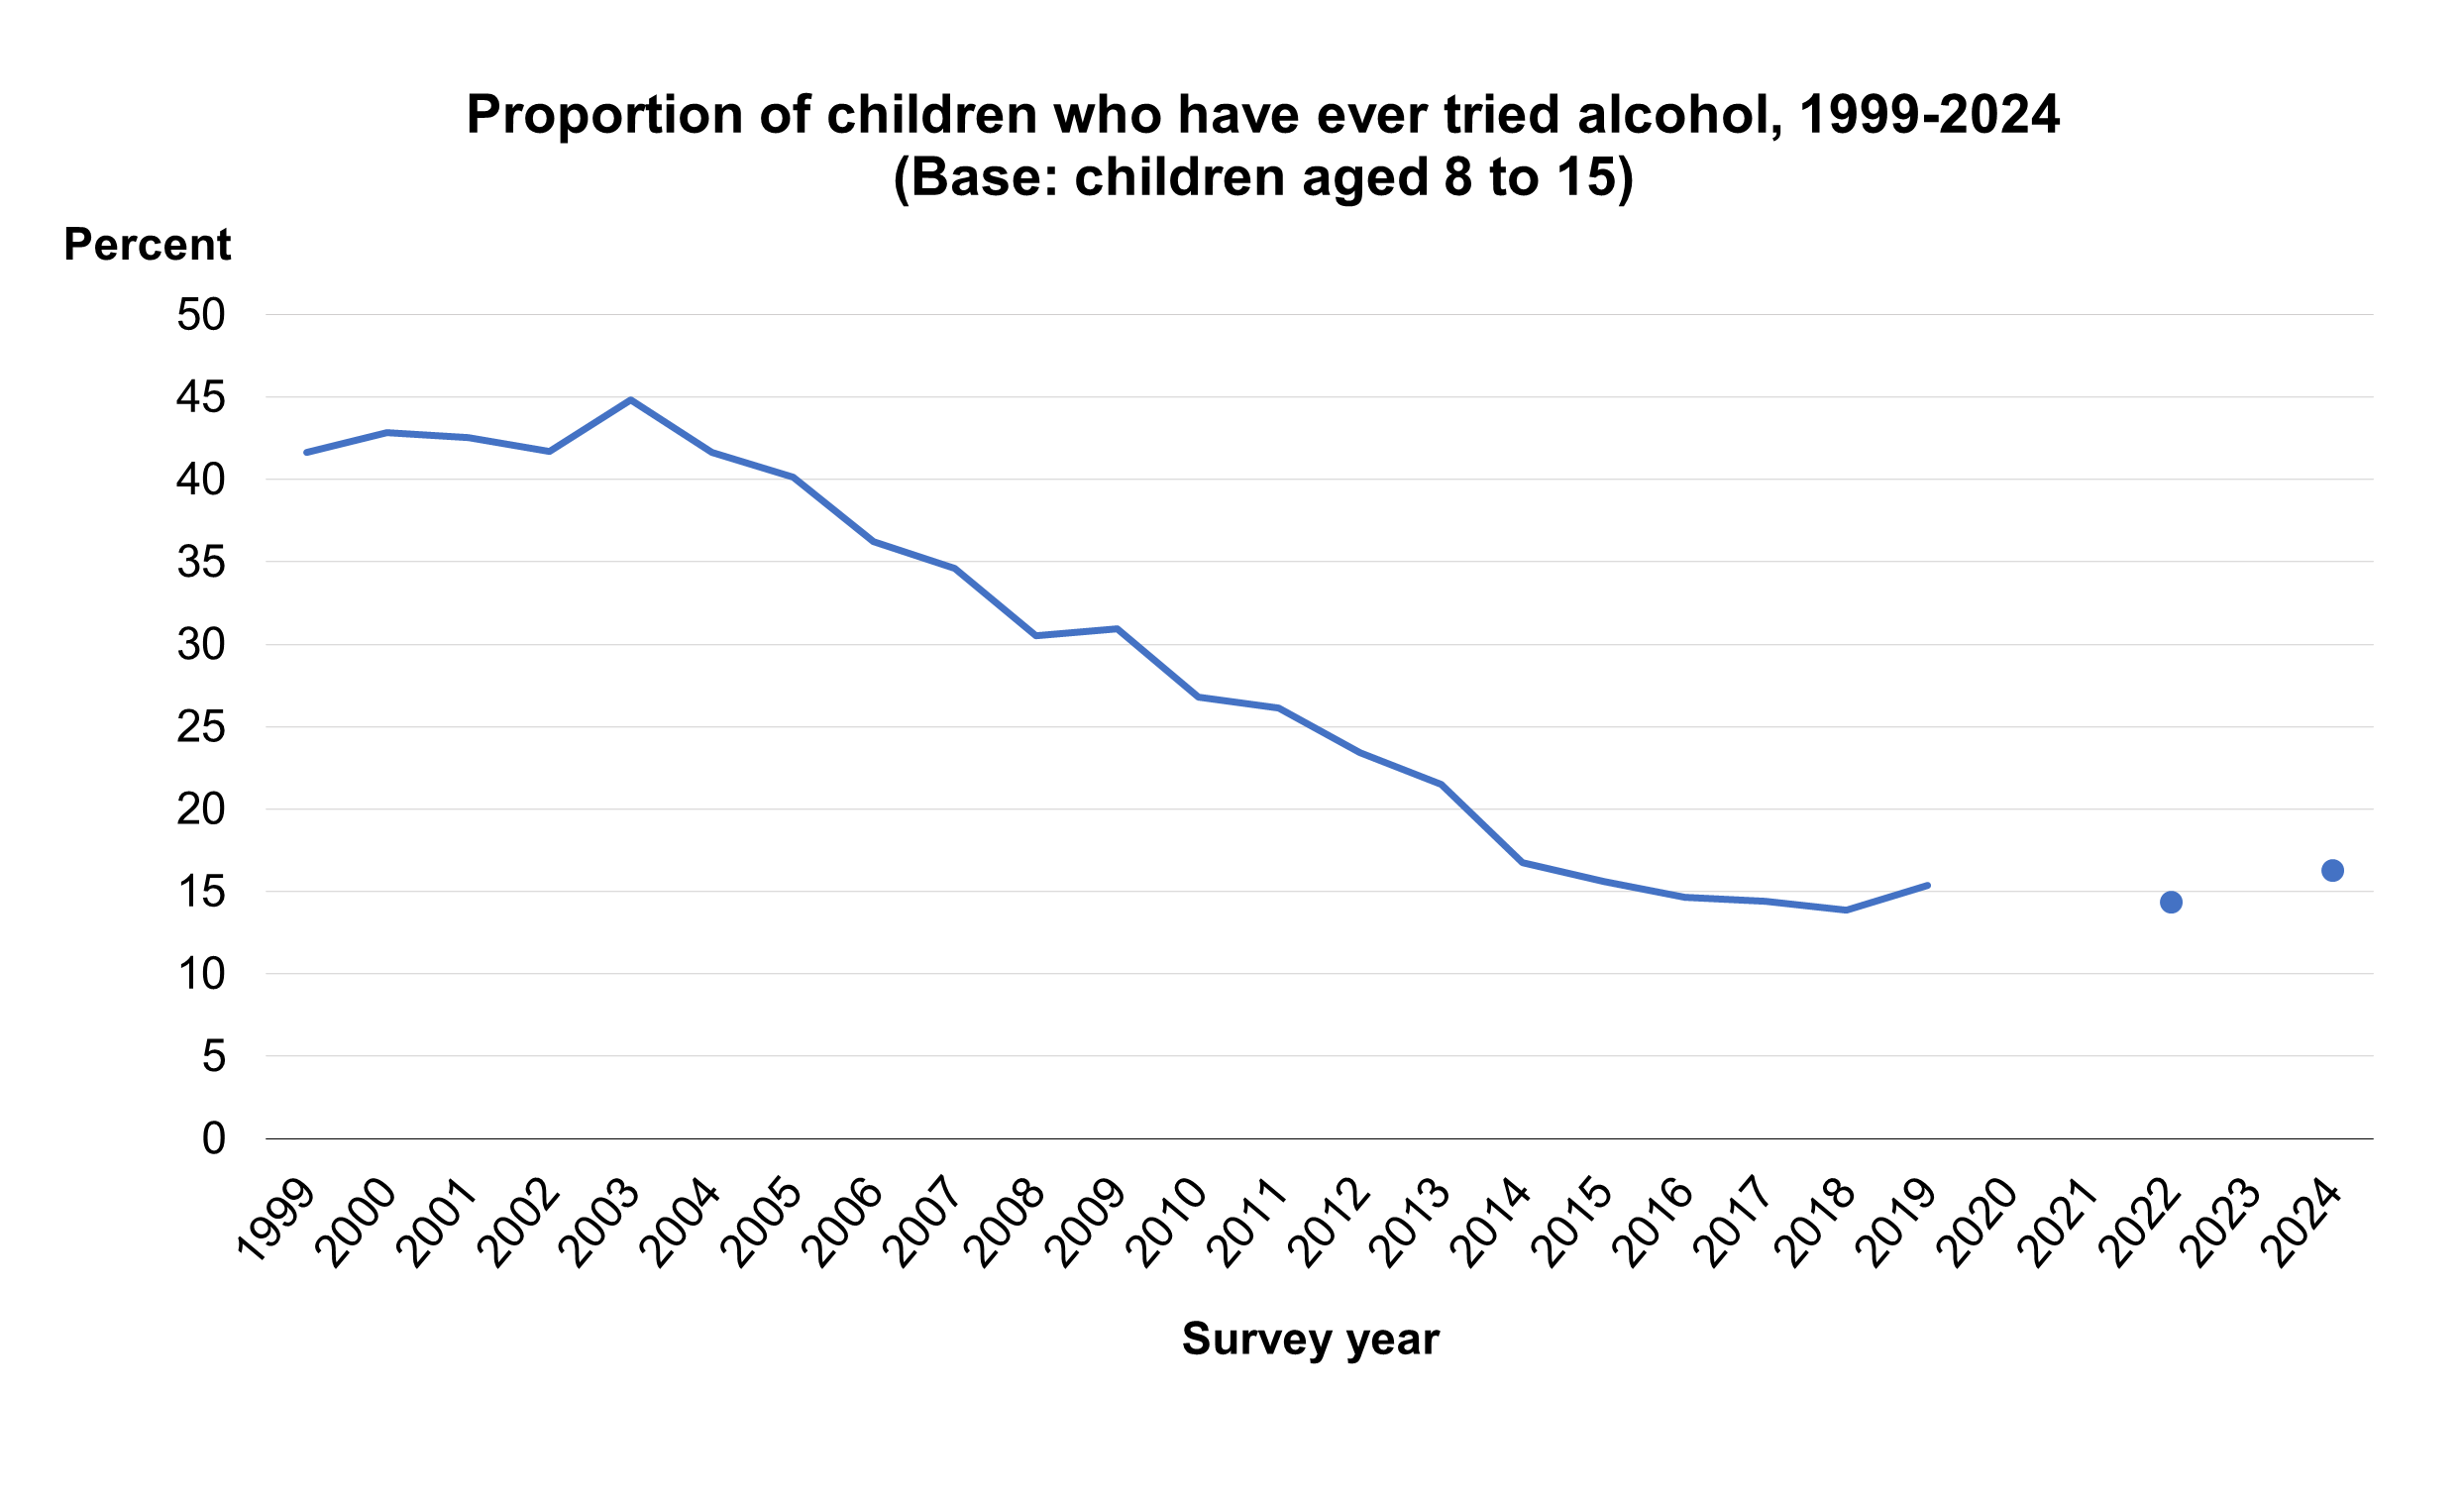
HSE data collection was paused in 2020 due to pandemic-related restrictions, meaning that insufficient data was collected for reporting. Numbers of child interviews in 2021 were also too low to be reported on. There was no annual survey in 2023.
Children’s experience of alcohol, by parents’ weekly alcohol consumption
To establish the alcohol consumption of children’s parents or guardians, data for adults who took part in the HSE interview were combined with their children’s records.
The proportion of children aged 8 to 15 reporting they had ever had a proper alcoholic drink varied by their mother’s and father’s weekly alcohol consumption. Looking at their mother’s alcohol consumption, prevalence of ever having had a proper drink was lowest among children whose mother had not drunk alcohol in the last 12 months (6%) and highest among children whose mother drank more than 14 units of alcohol per week, equivalent to drinking at increasing or higher risk levels (23%).
A similar pattern was observed in relation to fathers’ alcohol consumption. 7% of children whose father had not drunk alcohol in the last 12 months had ever had an alcoholic drink compared with 26% of children whose father drank alcohol at an increasing or higher risk level.
For more information: Table 10 and Table 11
Children's general health
Introduction
Self-assessed general health and longstanding illness are important indicators of the general health of the population. They are valid measures for predicting future health outcomes and can be used to project the use of health services and provide information and insight for policy development.
Methods and definitions
Information was collected for children about self-reported general health, longstanding illness, and acute sickness. In 2012, the questions on longstanding illness were changed to be consistent with the harmonised disability questions designed for use in social surveys, as recommended by the Disability, Health and Carers Primary Standards in 2011. The new questions meet government requirements for the classification of disability for the core population with rights under the Equality Act. These questions explicitly ask about physical and mental health, separate the concept of disability from illnesses or health conditions, and refer to illnesses or conditions ‘lasting or expecting to last longer than 12 months or more’ rather than ‘over a period of time’. A longstanding illness is defined as limiting if the participant reports that it reduces their ability to carry out day-to-day activities.
Acute sickness is defined as any illness or injury (including longstanding conditions) that has caused the participant to cut down in the last two weeks on things they usually did.
Parents or guardians answered on behalf of children aged 0 to 12, and children aged 13 to 15 answered their own questions, with a parent or guardian present.
Children’s general health, by survey year, age and sex
In 2024, 94% of boys and girls aged 0 to 15 reported very good or good general health (boys 94% and girls 94%). The proportion of children reporting very good or good health between 1995 and 2024 varied between 91% and 96% with no clear pattern.
For more information: Table 12
Children’s longstanding illness, by survey year, age and sex
18% of children aged 0 to 15 had a longstanding illness. Between 1995 and 2002 prevalence varied between 20% and 27%, then between 14% and 19% since 2003.
Boys (21%) were more likely than girls (15%) to have a longstanding illness.
Prevalence of a longstanding illness increased with age, from 8% among children aged 0 to 1 to 26% among those aged 13 to 15.
11% of children aged 0 to 15 had a limiting longstanding illness. Between 2003 and 2024 prevalence of a limiting longstanding illness varied between 6% and 12%, with rates between 7% and 9% between 2003 and 2019, and between 11% and 12% 2022 and 2024.
Similarly to what was observed for longstanding illness, the proportion of children with a limiting longstanding illness increased with age, from 1% of those aged 0 to 1 to 17% of those aged 13 to 15. Similar proportions of boys and girls had a limiting longstanding illness (13% and 10% respectively).
For more information: Table 13
Children’s acute sickness, by survey year, age and sex
In 2024, the prevalence of acute sickness in children aged 0 to 15 was 10%. This represents an overall decrease since 1995, from 14% in 1995. Between 1995 and 2010, prevalence varied between 9% and 14%, and since 2011 between 8% and 10%.
Acute sickness was more common among boys (11%) than girls (8%).
For more information: Table 14
Last edited: 27 January 2026 9:34 am