Publication, Part of Health Survey for England
Health Survey for England, 2024
Official statistics, National statistics, Survey, Accredited official statistics
Adults’ overweight and obesity
Summary
This report examines the prevalence of overweight and obesity among adults in 2024.
Detailed tables accompanying this report can be accessed here.
Key findings
-
In 2024, 30% of adults aged 16 and over were living with obesity, and 66% were either overweight or living with obesity. The prevalence of overweight (including obesity) was more common among men (70%) than women (62%).
-
Obesity prevalence increased with age, being 18% among adults aged 16 to 24 and peaking among adults aged 55 to 74 (between 35% and 36%).
-
70% of adults had a waist-to-height ratio above the recommended level of 0.5, classified as increased (including high) central adiposity. 28% of adults had a waist-to-height ratio of 0.6 or more, classified as high central adiposity.
-
Prevalence of increased (including high) central adiposity was 29% among those who were a healthy weight, 89% among those who were overweight and 99% among those living with obesity.
-
Using ethnic-specific BMI thresholds to define cardiometabolic risk, 31% of adults were classified as high cardiometabolic risk and 66% as increased or high cardiometabolic risk. Prevalence of high cardiometabolic risk was highest among the Black ethnic group (56%) and lowest among the White, Mixed and Other ethnic groups (between 29% and 31%).
Introduction
Obesity is a major public health problem in England and globally (Source: World Health Organization, 2025). In adults, overweight and obesity are associated with life-limiting conditions, such as Type 2 diabetes, cardiovascular disease, and some cancers.
The burden on the NHS due to obesity and related illnesses is well recognised. The monetary cost each year, uplifted for inflation, was estimated at £6.5 billion in 2022 (Source: Frontier Economics, 2022).
The COVID-19 pandemic has had a disproportionate effect on people with obesity, who are at increased risk of being hospitalised, admitted to intensive care, and of dying from COVID-19 (Sources: Public Health England, 2020, ONS, 2022, Saul, Gursul and Piernas, 2022).
The Health Survey for England (HSE) is the main data source for monitoring levels of overweight and obesity in the general population in England. Measured height and weight were used to calculate body mass index (BMI). Waist measurements were also taken, to monitor central (abdominal) adiposity.
Methods and definitions
Methods
Height and weight were measured during the interviewer visit, while waist circumferences were measured during the health visit, for both adults and children.
Full details of the protocols for carrying out all the measurements are contained in the HSE 2024 Methods report, available on the first page.
Definitions
Body mass index among adults
To define overweight or obesity, a measurement of height is required that allows for differences in weight due to height. A widely accepted measure of weight for height, body mass index (BMI), defined as weight in kilograms divided by the square of the height in metres (kg/m2), is used for this purpose in the HSE series.
Participants were classified into BMI groups according to the NICE guidance, set out in Table A.
|
BMI (kg/m2) |
Description |
|
Less than 18.5 |
Underweight |
|
18.5 to less than 25 |
Healthy weight |
|
25 to less than 30 |
Overweight, not obesity |
|
30 or more |
Obesity, including severe obesity |
|
40 or more |
Severe obesity |
BMI categories of overweight and obese were combined to show the proportion of participants who were either overweight or living with obesity (BMI 25kg/m2 or more). A BMI threshold of 30kg/m2 was used to define participants as living with obesity, and a subset of the obese category was also used to define severe obesity (BMI 40kg/m2 or more). These definitions were applied to all participants aged 16 and over, as this is how adults are defined in the HSE series.
Waist-to-height ratio among adults
BMI does not distinguish between mass due to body fat and mass due to muscular physique. It also does not take account of the distribution of fat. It has therefore been suggested that waist circumference, or waist-to-height ratio may be useful supplements to BMI to identify central (abdominal) obesity, which increases the health risk from being overweight (Source: Ashwell et al, 2011).
NICE guidance since 2022, has recommended to classify the degree of central adiposity based on waist-to-height ratios, with the message that adults should keep their waist-to-height ratio below 0.5 (so that their waist measurement is less than half their height) (Source: NICE). Waist-to-height ratio is thought to offer a more precise estimate of central adiposity than BMI, since it uses waist circumference in the calculation.
BMI, overweight and obesity
Height and weight
In 2024, the mean height of men was 175.8cm, and of women was 162.1cm. Height in men has increased by less than 2cm since 1993 (174.4cm), and height in women has increased by just over 1cm in that period (from 161.1cm in 1993) with small fluctuations from year-to-year.
Between 1993 and 2024, mean weight increased from 78.9kg to 86.2kg among men, and from 66.6kg to 73.0kg among women.
For more information: Table 1 and Table 2
BMI, by age and sex
Mean BMI has increased since the start of HSE data collection, from 25.8kg/m2 in 1993 to 27.8kg/m2 in 2024. There has been relatively little change in mean BMI among adults in recent years.
In 2024, mean BMI generally increased with age and was lowest among adults aged 16 to 24 (25.0kg/m2) and highest among those aged 55 to 64 (28.7kg/m2).
For more information: Table 3 and Table 4
Overweight and obesity, by age and sex
In 2024, 30% of adults were living with obesity, and 66% were either overweight or living with obesity. Obesity prevalence increased with age, from 18% of adults aged 16 to 24, to between 35% and 36% among adults aged 55 to 74 years.
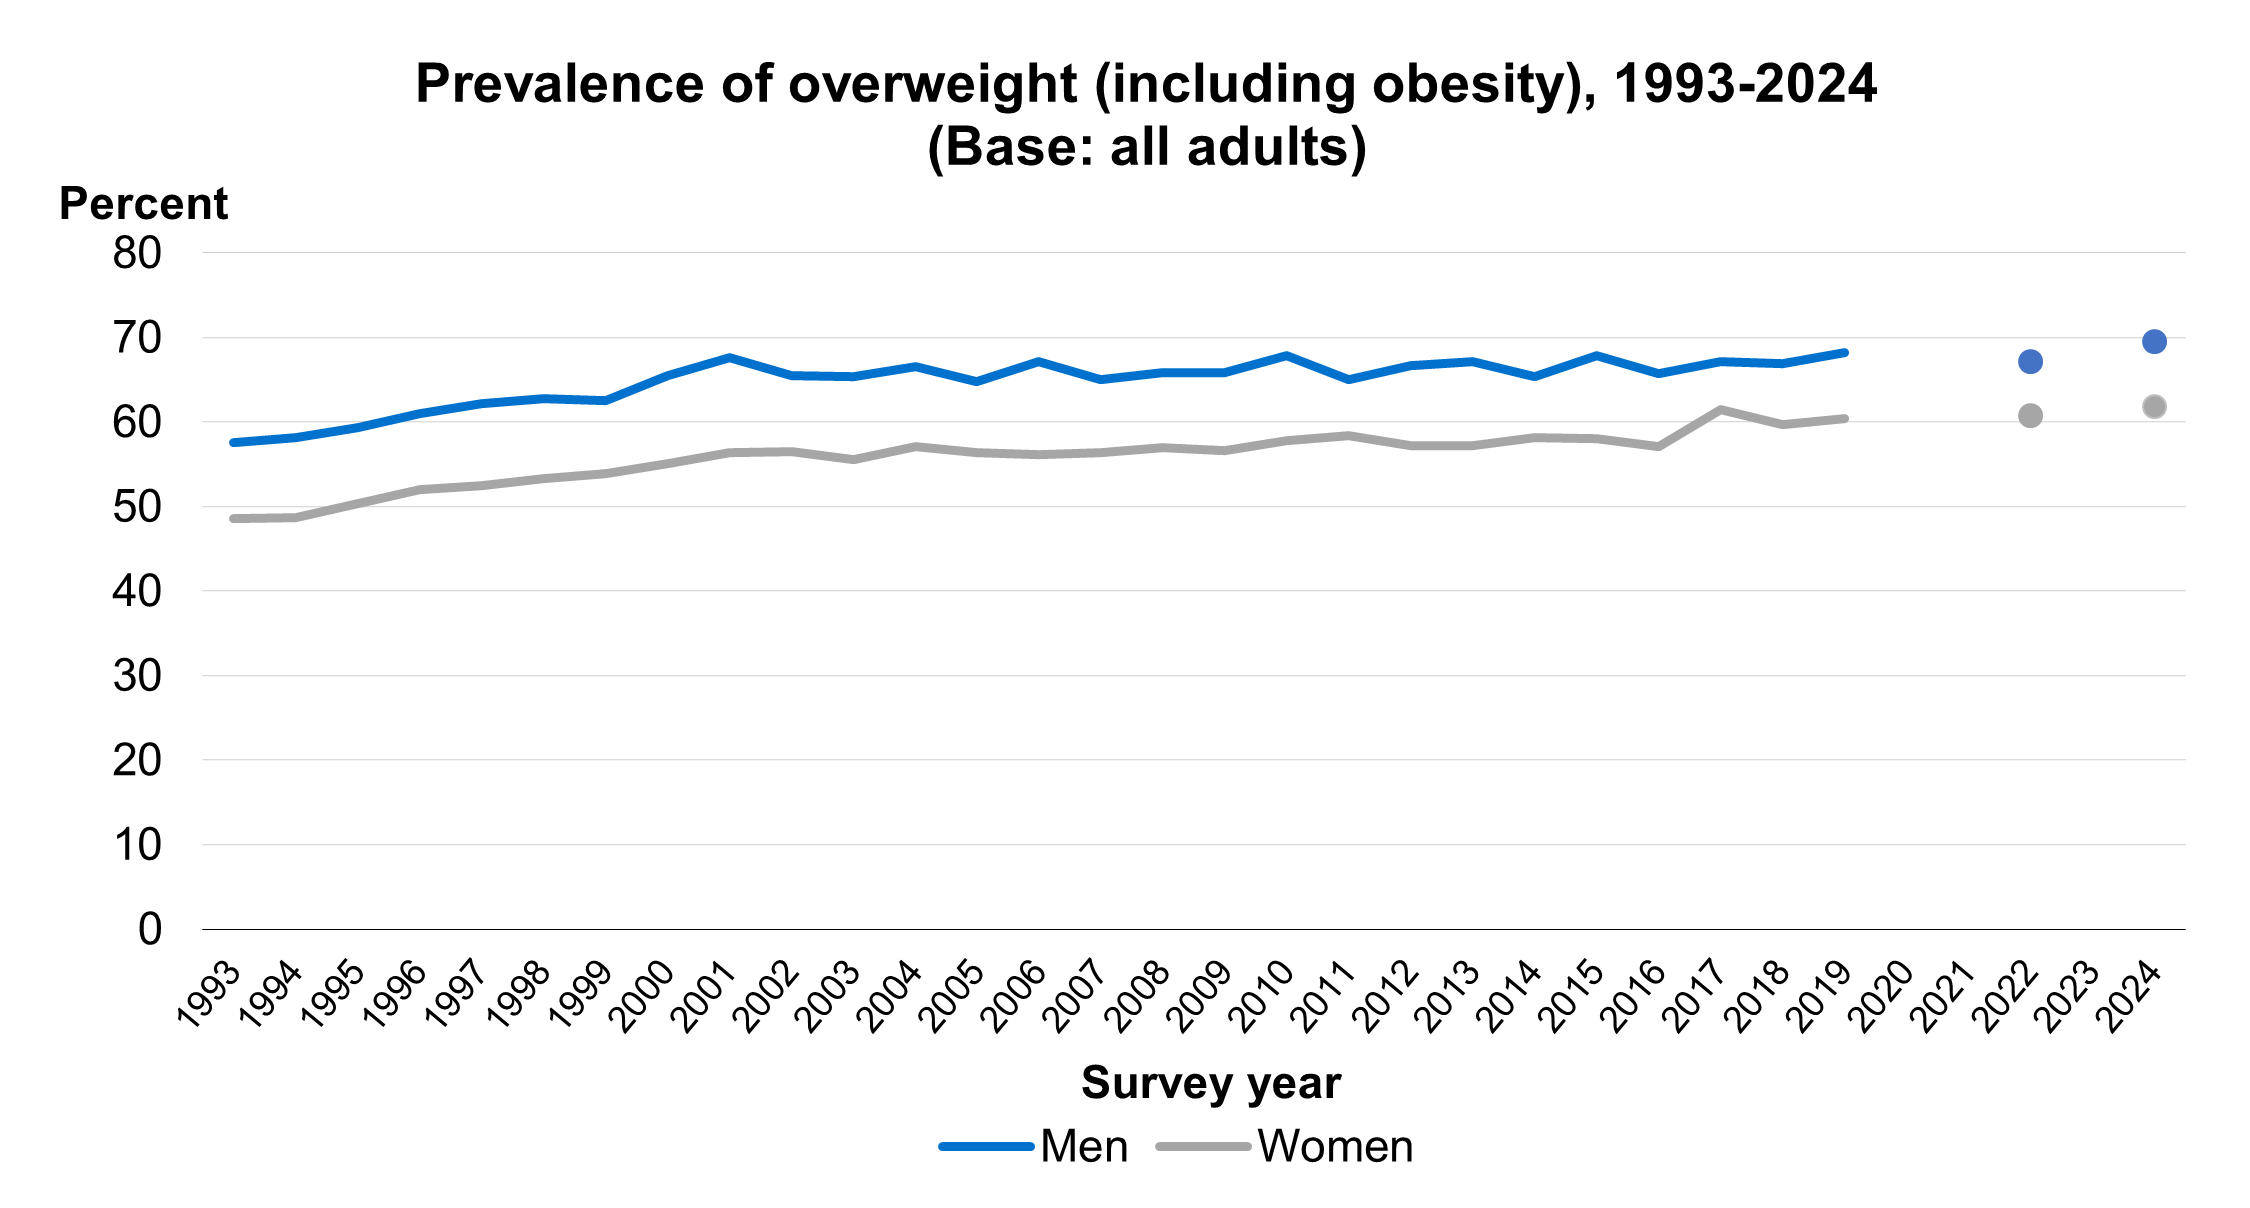
Prevalence of overweight (including obesity) was higher among men (70%) than women (62%). The proportion living with obesity was similar across men (29%) and women (31%).
For more information: Table 3 and Table 4
Trends in adult overweight and obesity
Overweight (including obesity) increased from 53% in 1993 to 62% in 2001. Since then, the trend has been more gradual, ranging from 61% in 2005 to 66% in 2024, with fluctuations year-on-year.
The proportion of men who were overweight or living with obesity in 2024 was 70%. This was similar to levels observed in previous years, with levels fluctuating between 66% and 68% since 2015.
From 2017 to 2022, overweight (including obesity) among women ranged between 60% and 62% The proportion of women who were overweight or living with obesity (62%) in 2024 was also similar to previous years.
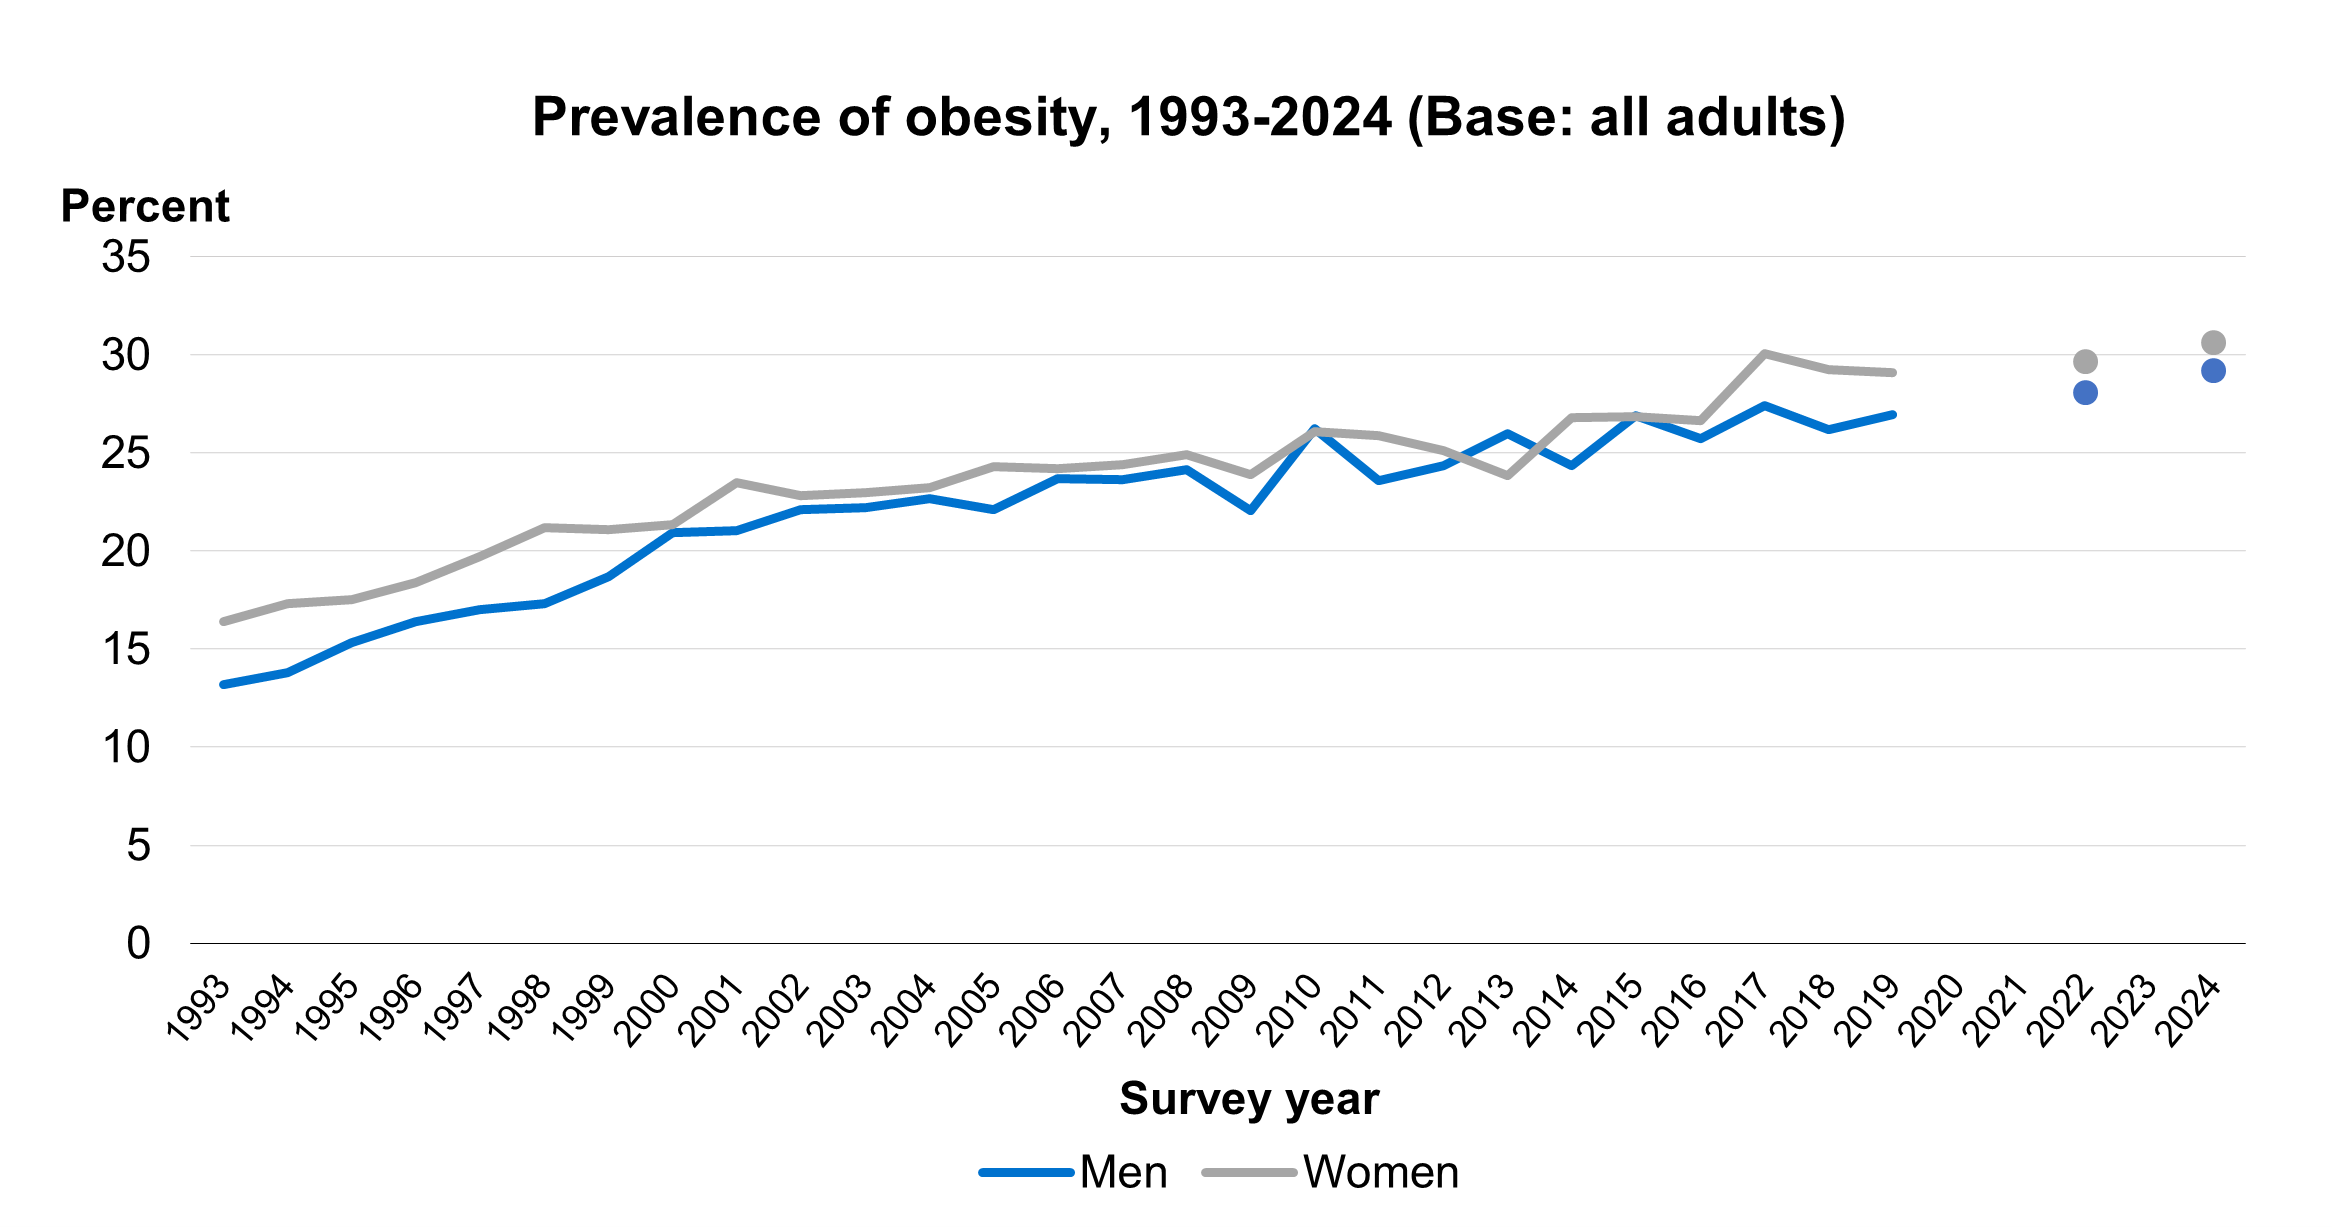
Prevalence of obesity in adults increased rapidly between 1993 and 2008 (from 15% to 25%) and more slowly since then, increasing to 30% by 2024. Survey estimates are subject to a margin of error (see ‘About the survey estimates’ in the Introduction to this report). It is likely that, in 2024, the proportion of adults living with obesity was between 28.4% and 31.5% (the 95% confidence interval).
In 2024 the proportion living with obesity was similar between men and women.
29% of men were living with obesity in 2024. This is similar to recent years, with prevalence of obesity among men varying between 26% and 28% in the period 2015 to 2022.
From 2017 to 2022, obesity prevalence among women ranged between 29% and 30%. This proportion was also similar in 2024 (31%).
Note that in 2024 the proportion living with obesity was similar between men and women. 2021 data are not directly comparable with other years due to changes in survey methodology and response rates, and as such are excluded from the trend analysis. The overweight and obesity findings presented in the HSE 2021 report were based on self-reported rather than measured height and weight.
Overweight and obesity, by employment status
The proportion of adults aged 16 to 64, who were overweight or living with obesity varied by employment status. It was highest among those in employment (66%), followed by those categorised as ‘other economically inactive’ (55%), and lowest among those who were unemployed (46%). Severe obesity, on the other hand, was highest among those who were unemployed and those categorised as ‘other economically inactive’ (6%) compared with 3% among those who were in employment.
For more information: Table 5
Overweight and obesity, by region
Overweight and obesity prevalence estimates by region are shown in the tables as both observed and age-standardised. Comparisons between regions are based on the age-standardised data, which account for the different regional age profiles.
The mean (age-standardised) BMI of adults varied by region, and was highest in the North East (28.7kg/m2) and lowest in London (26.6kg/m2).
The age-standardised prevalence of overweight or obesity among adults differed by region. Obesity was most prevalent in the North East (36%) and least prevalent in London (21%). Overweight (including obesity) followed a similar pattern, being highest in the North West (70%) and North East (69%) and lowest in London (57%).
For more information: Table 6
Overweight and obesity, by area deprivation and sex
BMI category by area deprivation is shown in the table as age-standardised.
When controlling for age, mean BMI among adults was greater in more deprived areas, increasing from 27.0 kg/m2 in the least deprived areas to 28.9kg/m2 in the most deprived areas. Mean BMI increased more steeply with area deprivation among women (26.5kg/m2 to 29.5kg/m2) than among men (27.4kg/m2 to 28.4kg/m2).
The prevalence of obesity and overweight (including obesity) were higher in more deprived areas than in less deprived areas among both men and women. Prevalence of obesity increased more steeply with area-deprivation for women, increasing from 23% in the least deprived areas to 41% in the most deprived areas. Among men, the corresponding figures were 28% and 34%.
For more information: Table 7
Overweight and obesity, by ethnic group and sex
After accounting for age differences, the mean BMI varied by ethnic group and the pattern was different for men and women. Among men, adults in the Asian group had the lowest mean BMI (26.9kg/m2). This compared with 27.8kg/m2 and 28.0kg/m2 among men in the White and Mixed groups.
Among women, the differences in mean BMI between ethnic groups were larger than among men. Among women, mean BMI was lowest in the Asian group (26.3kg/m) and highest in the Black group (29.3kg/m2).
Using ethnic-specific BMI thresholds to define cardiometabolic risk, 31% of adults were classified as being at high risk, and 66% were classified as being of increased or high cardiometabolic risk. A higher proportion of men (70%) than women (62%) were classified as being at increased or high cardiometabolic risk.
Cardiometabolic risk was lowest in the Other, White and Mixed ethnic groups (between 29% and 31% of adults in these ethnic groups had high levels of cardiometabolic risk, and between 61% and 69% had increased or high levels of risk). Conversely, 56% of adults in the Black ethnic group were classified as being in the high cardiometabolic risk category (86% were classified as increased or high risk).
For more information: Table 8
Waist-to-height ratio
Waist circumference, by age and sex
Mean waist circumference was greater among men (98.4cm) than women (88.7cm) and increased with age. Among men, mean waist circumference increased from 91.6cm among those aged 16 to 24, to 103.5cm among those aged 75 and over. Among women, mean waist circumference increased from 82.1cm among those aged 16 to 24 to 92.6cm among those aged 65 and over.
For more information: Table 9
Waist-to-height ratio, by age and sex
Since 2022, NICE has recommended that adults keep their waist-to-height ratio below 0.5 (so that their waist measurement is less than half their height) (source: NICE).
In 2024, the mean waist-to-height ratio was 0.55 among all adults. This was greater among men (0.56) than women (0.55). Among all adults, the mean waist-to-height ratio increased with age, from 0.51 among those aged 16 to 34 to 0.59 among those aged 65 and over.
70% of adults had a waist-to-height ratio above the recommended level, classified as increased (including high) central adiposity. This included 42% with increased and 28% with high central adiposity.
Increased (including high) central adiposity was more common among men (74%) than women (66%), and prevalence rose more steeply with age among men than among women. Prevalence of increased (including high) central adiposity rose from 50% among men aged 16 to 34 to 94% among those aged 75 and over. Among women, these proportions were 46% and 84% respectively.
For more information: Table 9
Waist-to-height category, by BMI category and sex
The proportion of adults with increased including high central adiposity (above the recommended level of 0.5) was greater among adults with a higher BMI. 29% of adults who were a healthy weight had increased (including high) central adiposity increasing to 89% of adults who were overweight and 99% of adults living with obesity.
The proportion of adults with high central adiposity also varied by BMI category, from 1% of those who were a healthy weight to 17% of those who were overweight and 75% of those living with obesity.
Among adults who were underweight, 99% had a waist-to-height ratio below 0.5.
For more information: Table 10
Waist-to-height category, by area deprivation
Waist-to-height ratio category by area deprivation is shown in the table as age-standardised.
After controlling for age, the prevalence of increased (including high) central adiposity was higher in areas with higher levels of deprivation than in areas with lower levels of deprivation. Prevalence ranged from 65% among those in the least deprived areas to 77% among those in the most deprived areas.
A similar pattern was observed for prevalence of high central obesity. This was lowest in the least deprived areas (22%) and highest in the most deprived areas (39%).
For more information: Table 11
Overweight, obesity and diabetes
Background
Diabetes is characterised by high blood glucose levels (hyperglycaemia). Untreated hyperglycaemia is associated with damage and possible failure of many organs, especially the eyes, kidneys, nerves, heart, and blood vessels. Diabetes substantially increases the risk of cardiovascular disease (CVD) and tends to worsen the effect of other risk factors for CVD, such as abnormal levels of blood fats, raised blood pressure, smoking and obesity (Source: Garcia et al, 1974). Being overweight is a risk factor for Type 2 diabetes (Source: Diabetes UK).
Doctor-diagnosed diabetes was measured by asking participants:
-
do you now have, or have you ever had diabetes?
-
[if yes] were you told by a doctor that you had diabetes?
Doctor-diagnosed and total diabetes, by BMI category and sex
Total prevalence of diabetes among adults aged 16 and over was 9%. This comprised 7% with diagnosed and 2% with undiagnosed diabetes. For more data about diabetes see the HSE 2024 report on Adults’ health.
Data in Table 12 are shown as age-standardised for BMI categories.
After accounting for age, the prevalence of doctor-diagnosed diabetes varied by BMI category, increasing from 4% of adults who were a healthy weight to 9% among those living with obesity.
When accounting for age, undiagnosed diabetes also varied by BMI category, with prevalence increasing from 1% of those who were a healthy weight to 4% of those living with obesity.
Taking diagnosed and undiagnosed diabetes together, 5% of adults who were a healthy weight had diabetes, compared with 8% of those who were overweight and 13% of those living with obesity.
For more information: Table 12
Doctor-diagnosed and total diabetes, by waist-to-height categories and sex
Data in Table 13 are shown as age-standardised for waist-to-height ratio categories
After accounting for age, the prevalence of total diabetes varied by waist-to-height ratio category. The proportion with total diabetes was 3% among those classified as healthy central adiposity, 7% among those with increased central adiposity and 14% among those with high central adiposity.
When accounting for age, undiagnosed diabetes followed a similar pattern. 1% of those with healthy central adiposity had undiagnosed diabetes, 2% with increased and 4% with high central adiposity did so.
For more information: Table 13
Last edited: 27 January 2026 9:34 am