Publication, Part of Health Survey for England
Health Survey for England, 2024
Official statistics, National statistics, Survey, Accredited official statistics
Adults' health
Summary
This report examines the general health of adults aged 16 and over, as well as the prevalence of diabetes, raised cholesterol and hypertension. These are established risk-factors for cardiovascular diseases (CVD). The prevention of CVD can result in reductions in premature mortality and morbidity. CVD has been identified as a clinical priority in the NHS Long Term Plan (Source: NHS England). Detailed tables accompanying this report can be accessed here.
Key findings
- In 2024, 46% of adults aged 16 and over had at least one longstanding illness or condition. A higher proportion of women (48%) than men (44%) had a longstanding illness.
- 18% of adults reported that they had acute sickness in the past two weeks. The prevalence of acute sickness was higher among women (20%) than men (16%).
- The prevalence of total diabetes, including doctor-diagnosed and undiagnosed diabetes, was 9%. This comprised 7% of adults with doctor-diagnosed diabetes and 2% with undiagnosed diabetes.
- The proportion of adults with raised cholesterol was 48%. This was greater among women (50%) than men (45%). The proportion increased with age. Among women it was highest among those aged 55 to 64 (72%); among men it was highest among those aged 45 to 54 (65%).
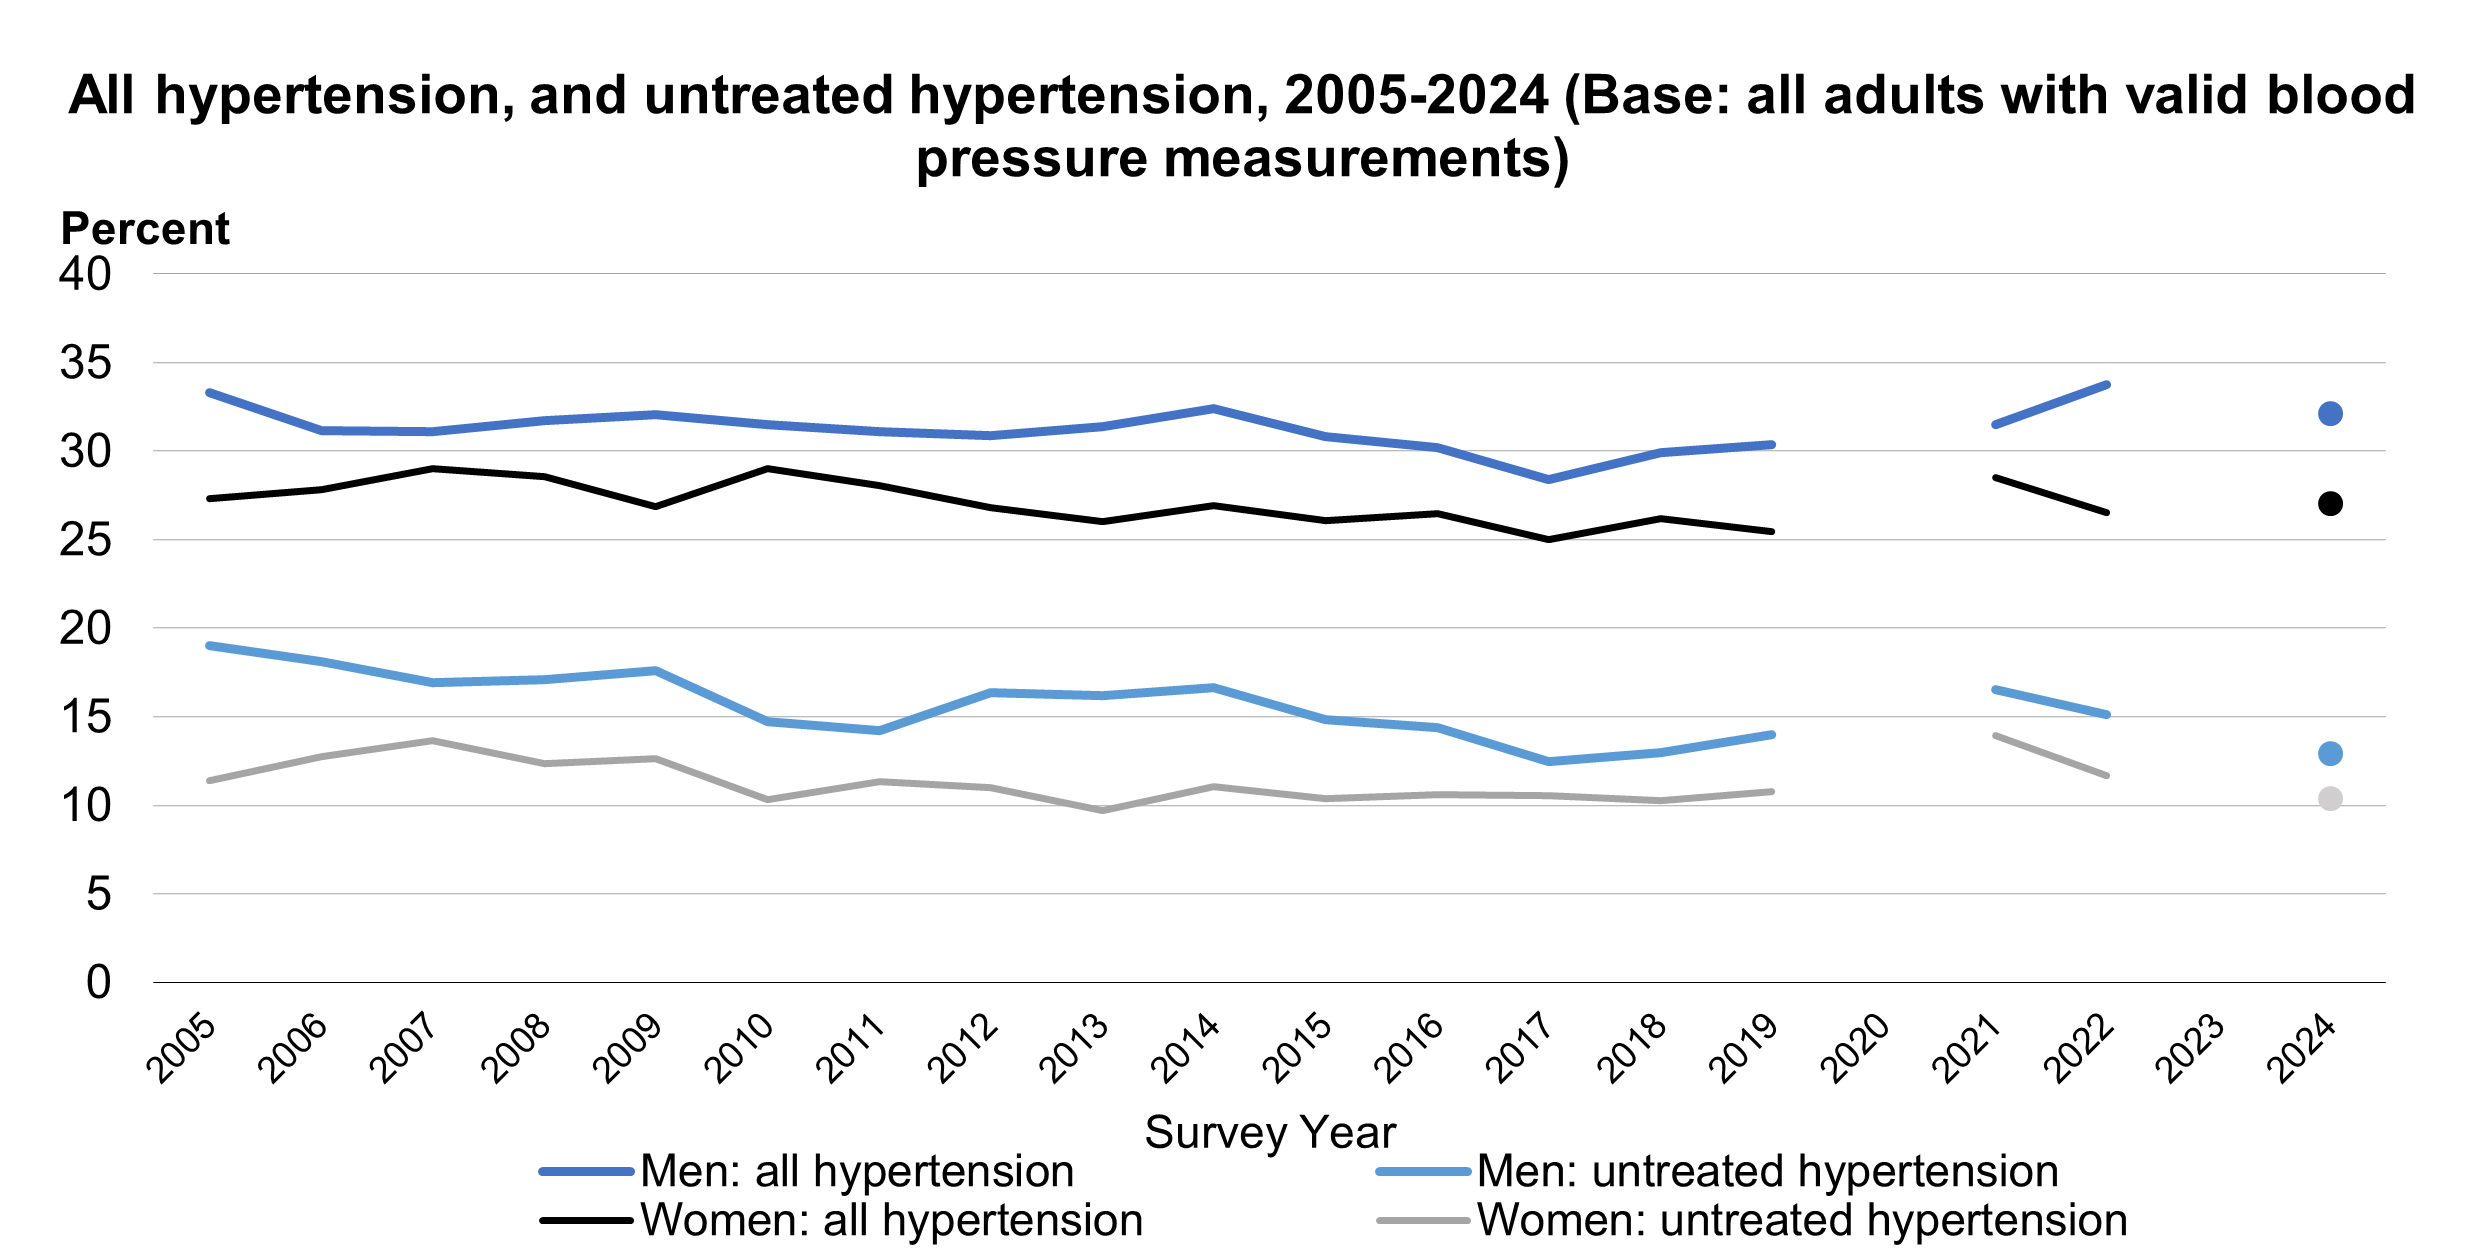
- 30% of adults had hypertension (high blood pressure), with men (32%) more likely to have hypertension than women (27%). Untreated hypertension increased with age, with prevalence highest among those aged 75 and over (18%).
General health
Background
Self-assessed general health is an important indicator of the general health of the population. It is a valid measure for predicting future health outcomes and can be used to project use of health services and provide information useful for policy development. In older people, self-assessed poor overall health has been associated with increased mortality risk (Source: Mossey and Shapiro, 1982) and functional decline (Source: Idler and Kasi, 1995).
Methods and definition
Participants were asked ‘how is your health in general?’ and offered five response options: very good, good, fair, bad, or very bad. The responses to this question are described as self-reported general health.
Self-reported general health and sex
In 2024, 72% of adults reported good or very good general health. 19% said their health was fair and 9% reported bad or very bad health.
For more information: Table 1
Trends in self-reported general health
Between 1993 and 2022, the proportion reporting very good or good general health varied between 74% and 78% among men and between 73% and 76% among women with no clear pattern. In 2024, among men and women, 72% reported very good or good general health.
The prevalence of bad or very bad general health among adults remained steady at 5% between 1993 and 1995. From 1996 to 2022, this proportion varied between 6% and 8%. In 2024, among adults this was 9%.
For more information: Table 1
Acute sickness
Definition
Acute sickness is defined as any illness or injury (including any longstanding condition) that has caused the participant to cut down on things they usually do in the last two weeks.
Acute sickness by sex
18% of adults reported that they were affected by acute sickness in the past two weeks. The prevalence of acute sickness was higher among women (20%) than men (16%).
Trends in acute sickness
Over the period 1993 to 2024, the prevalence of acute sickness was consistently higher among women than among men. Between 2003 and 2022, the prevalence of acute sickness fluctuated between 12% and 15% among men, and 16% and 19% among women. In 2024, 16% of men and 20% of women had an acute sickness.
For more information: Table 1
Longstanding conditions
Background
Longstanding conditions affect the body or mind for 12 months or more. Most longstanding conditions increase in prevalence with age, and vary in their effects on individuals, from minimal impact to disability. Most longstanding conditions are managed in the community, but some require inpatient stays, or domiciliary or residential care. Some of the longstanding conditions treated by GPs are monitored through the Quality Outcomes Framework (QOF) for prevalence and achievement of treatment targets.
Methods and definitions
The questions on longstanding conditions are included in the main HSE interview. Prior to 2012, the question referred to ‘an illness, disability or infirmity…that has troubled you over a period of time or that is likely to affect you over a period of time’. In 2012, the questions on longstanding conditions were changed to be consistent with the Office for National Statistics (ONS) harmonised disability questions designed for use in social surveys (HSE 2012). Participants were asked the question ‘do you have any physical or mental health conditions or illnesses lasting or expected to last 12 months or more?’
Participants who reported that they had a physical or mental health condition or illness lasting or expected to last 12 months or more were further asked ‘what is the matter with you?’, and their answers for up to six conditions were recorded verbatim. These were coded into 42 conditions, which were further grouped into the 14-chapter categories of the ICD-10, covering infectious and non-communicable diseases of the body and mind.
Prevalence of longstanding conditions, by sex
In 2024, 46% of adults aged 16 and over had at least one longstanding illness or condition. Participants could record up to six conditions. Therefore, the overall prevalence of having any longstanding condition is lower than the combined prevalence of individual conditions.
Survey estimates are subject to a margin of error (see ‘About the survey estimates’ in the Introduction to this report. It is likely that in 2024 the proportion of adults with longstanding conditions was between 41.9% and 46.2% among men and 45.8% to 49.5% among women.
The most common conditions were:
- conditions of the musculoskeletal system (17%)
- mental, behavioural and neurodevelopmental conditions (12%)
- conditions of the heart and circulatory system (11%)
- diabetes and other endocrine and metabolic conditions (9%)
- conditions of the respiratory system (8%)
Other types of longstanding conditions had prevalence levels of 5% or below.
Women were more likely than men to have one or more longstanding conditions (48% compared with 44%).
Among the most common conditions, women were more likely than men to have:
- musculoskeletal conditions (19% compared with 14%).
- mental, behavioural and neurodevelopmental conditions (14% compared with 11%).
Heart and circulatory conditions were more commonly reported by men than women (12% compared with 10%).
For more information: Table 1, Table 2 and Table A1
Trends in longstanding conditions
The current HSE question wording for longstanding conditions was introduced in 2012, and as such, trends prior to 2012 are not discussed.
Since 2012, there was a gradual increase in the prevalence of longstanding conditions among men, from 35% in 2012 to 40% in 2016. Between 2016 and 2022, prevalence fluctuated between 39% and 41%.
In 2024, the prevalence of longstanding illness was 44% among men.
Among women, prevalence was stable at 41% between 2012 and 2015, then fluctuated between 43% and 45% between 2016 and 2022.
In 2024, the prevalence of longstanding illness was 48% among women. Survey estimates are subject to a margin of error. It is likely that in 2024 the proportion of adults with longstanding conditions was between 41.9% and 46.2% among men and 45.8% to 49.5% among women.
For more information: Table 1 and Table A1
Diabetes
Background
Diabetes is characterised by high blood glucose levels (hyperglycaemia).
Untreated, hyperglycaemia is associated with damage and possible failure of many organs, especially the eyes, kidneys, nerves, heart, and blood vessels. Diabetes substantially increases the risk of cardiovascular disease (CVD) and tends to worsen the effect of other risk factors for CVD, such as abnormal levels of blood fats, raised blood pressure, smoking and obesity (Source: Garcia et al, 1974). Diabetes (both Types 1 and 2) is a leading cause of avoidable mortality. (Source: World Health Organization)
Methods and definitions
The HSE measures diabetes in two ways. The prevalence of self-reported doctor-diagnosed diabetes is included in the main interview.
In addition to the interview question, glycated haemoglobin (HbA1c) levels are measured in blood samples collected during the health visit. HbA1c reflects average blood sugar levels over the previous two to three months and can therefore be used both to monitor diabetic control in people with diagnosed diabetes, and to detect undiagnosed diabetes (Source: World Health Organization, 2011).
The presence of doctor-diagnosed diabetes is identified if a participant answers yes to two questions:
- do you now have, or have you ever had, diabetes?
- were you told by a doctor that you had diabetes?
This report does not distinguish between Type 1 and Type 2 diabetes.
Total diabetes in the population includes all participants who reported having doctor-diagnosed diabetes, as well as those with a blood sample measured as having an HbA1c level of 48mmol/mol or above, diagnostic of diabetes. Participants with a raised HbA1c who did not report having doctor-diagnosed diabetes are defined as having undiagnosed diabetes.
Prevalence of doctor-diagnosed diabetes, by age and sex
In 2024, 8% of adults reported that a doctor had told them that they had diabetes.
The prevalence of doctor-diagnosed diabetes was higher among men (10%) than women (6%). Prevalence increased with age, from 1% of adults aged 16 to 24 to 16% of adults aged 75 and over.
For more information: Table 3
Prevalence of total diabetes, by age and sex
Estimates of the prevalence of total diabetes, using glycated haemoglobin levels, are limited to participants with a health visit and a valid HbA1c measurement.
Consequently, the estimates of those with doctor-diagnosed diabetes in Tables 4 and 5, which are limited to only those with a blood sample, vary slightly from those in Table 3 which shows the definitive estimates.
In 2024, the prevalence of total diabetes was 9%, comprised of 7% of adults with doctor-diagnosed diabetes and a further 2% with undiagnosed diabetes.
Prevalence of total diabetes increased with age, from 2% of adults aged 16 to 44 to 17% of adults aged 65 and over. The prevalence of total diabetes was higher among men (12%) than women (7%).
The prevalence of undiagnosed diabetes also increased with age, with different patterns for men and women. Among men, the prevalence was highest among those aged 45 to 64 (6%), whereas for women it was highest among those aged 65 and over (4%).
For more information: Table 4
Prevalence of total diabetes, by area deprivation
Prevalence of total diabetes by area deprivation is shown in the tables as age-standardised.
When controlling for age, prevalence of total diabetes generally increased with the level of area deprivation. 14% of adults living in the most deprived areas had total diabetes compared with 5% living in the least deprived areas.
The pattern by area deprivation differed for men and women, with the difference between the most and least deprived areas being larger for men. Prevalence of total diabetes among men varied from 7% in the least deprived areas to 17% in the most deprived areas. This compared with 4% in the least deprived areas and 11% in the most deprived areas among women.
For more information: Table 5
Trends in doctor-diagnosed diabetes
The proportion of adults with doctor-diagnosed diabetes increased between 1994 and 2009, from 3% to 7% among men and from 2% to 5% among women. Between 2010 and 2018 the proportion of men with doctor-diagnosed diabetes varied between 6% to 8%, and from 2019 to 2024 between 7% and 10%. Among women, the proportion was more stable varying between 5% and 6% from 2010 to 2024.
Note that 2021 data are not directly comparable with other years due to changes in survey methodology and response rates. See the HSE 2021 Methods report for details.
For more information: Table 3
Trends in total diabetes
Among men, levels of total diabetes, as identified through HbA1c levels, fluctuated between 9% and 10% from 2011 to 2018, and between 11% and 12% from 2019 to 2024. Among women, levels varied between 6% and 7% from 2011 to 2018, and from 7% to 9% between 2019 and 2024.
The prevalence of undiagnosed diabetes has fluctuated between 2% and 5% between 2011 and 2022. In 2024 the prevalence was 2%.
For more information: Table 4
Note that in 2021 self-reported diagnosed and undiagnosed diabetes came from the main interview, where the survey methodology differed to other years. HSE data collection was paused in 2020 due to pandemic-related restrictions, meaning that insufficient data was collected for reporting. There was no annual survey in 2023.
Cholesterol
Background
Cholesterol is a fatty substance (also referred to as a lipid) found in the blood and is needed by the body to function. There are different types of cholesterol including LDL (low density lipoprotein) cholesterol, VLDL (very low-density lipoprotein) cholesterol, and HDL (high density lipoprotein) cholesterol.
HDL cholesterol is beneficial, as it carries cholesterol away from the arteries back to the liver, where it can be excreted. Too much non-HDL cholesterol is harmful as it can clog blood vessels, causing them to become stiff and narrow, reducing blood flow. High cholesterol is a significant risk factor for cardiovascular disease (CVD), including narrowing of the arteries (atherosclerosis), heart attack (Source: Peters et al, 2016) and stroke (Source: Law, Wald and Rudnicka, 2003).
Methods and definitions
In the HSE, cholesterol levels are measured via blood samples taken at the health visit.
Raised total cholesterol, by age and sex
In 2024, the proportion of adults with raised cholesterol was 48%. This was higher among women (50%) than men (45%).
The prevalence of raised cholesterol varied by age, with different patterns for men and women. Among women, prevalence rose steadily with age up to a peak among those aged 55 to 64 years (72%). Among men, the proportion increased more steeply among younger age groups than seen for women and was highest among those aged between 45 and 54 (65%). Among adults aged 55 and over, the proportion with raised cholesterol was consistently higher among women than men.
For more information: Table 7
The proportion of adults aged 16 and over with low HDL cholesterol was 13%.
5% of adults had a total/HDL ratio of 6 or above, indicating high risk (the measure is above established limits for healthy levels of cholesterol). This proportion was higher among men (7%) than women (3%). The prevalence of a total/HDL ratio of 6 varied by age and was highest among adults aged 45 to 54 (9%).
For more information: Table 6 and Table 7
Raised total cholesterol, by area deprivation
Prevalence of raised total cholesterol by area deprivation is shown in the tables as age-standardised.
The prevalence of raised cholesterol did not vary by area deprivation.
For more information: Table 8
Trends in raised total cholesterol
The proportion of adults with raised total cholesterol declined from 1998 to 2019, from 66% to 40% among men, and from 67% to 45% among women.
In 2021, the proportion with raised cholesterol was higher than the previous trend, 56% among men and 61% among women. In 2024, this proportion was lower than in 2021; 45% among men, and 50% among women. See the Adult Health 2022, Cholesterol section for further description and a brief discussion of trends prior to 2024.
For more information: Table 6
Data for HSE 2012, 2013, 2015, 2016 are not shown. HSE data collection was paused in 2020 due to pandemic-related restrictions, meaning that insufficient data was collected for reporting. There was no annual survey in 2023.
Hypertension
Background
Hypertension (persistent high blood pressure) is an important public health challenge worldwide because of its high prevalence and the associated risk of cardiovascular disease (CVD). It is one of the most important modifiable risk factors for stroke, ischaemic heart disease (such as angina, heart attacks, and heart failure) and renal disease, and it is one of the most preventable and treatable causes of premature deaths worldwide (Source: World Health Organization, 2025).
Methods and definitions
Trend data on the prevalence of hypertension are presented for 2003 and from 2005 onwards, using measurements taken with the Omron HEM207 sphygmomanometer to measure blood pressure.
The HSE cannot be completely accurate in identifying people with hypertension as the definition requires persistently raised blood pressure. The HSE measures the blood pressure of each participant three times but on a single occasion.
Hypertension categories
High blood pressure is defined in this report as a systolic blood pressure (SBP) at or above 140mmHg or diastolic blood pressure (DBP) at or above 90mmHg or being on medication prescribed for high blood pressure. Participants are classified into one of four groups as follows:
- normotensive untreated: SBP below 140mmHg and DBP below 90mmHg, not currently taking medication for blood pressure
- hypertensive controlled: SBP below 140mmHg and DBP below 90mmHg, currently taking medication for blood pressure
- hypertensive uncontrolled: SBP at or greater than 140mmHg and/or DBP at or greater than 90mmHg, currently taking medication for blood pressure
- hypertensive untreated: SBP at or greater than 140mmHg and/or DBP at or greater than 90mmHg, not currently taking medication for blood pressure
Doctor-diagnosed and undiagnosed hypertension
The presence of doctor-diagnosed hypertension is identified if a participant answers yes to two questions:
- do you now have, or have you ever had, high blood pressure sometimes called hypertension?
- were you told by a doctor or nurse that you had high blood pressure?
Undiagnosed hypertension is defined as participants with a systolic blood pressure (SBP) at or above 140mmHg or diastolic blood pressure (DBP) at or above 90mmHg, who did not report having doctor-diagnosed hypertension. It differs from the definition of hypertension categories in Tables 10 to 11, as it does not consider information on medication. The combined proportion of those in the population with doctor-diagnosed and undiagnosed hypertension is referred to as total hypertension.
Prevalence of hypertension, by age and sex
30% of adults aged 16 and over had hypertension (high blood pressure). Survey estimates are subject to a margin of error (see ‘About the survey estimates’ in the Introduction. It is likely that in 2024 the proportion of adults with hypertension was between 27.7% and 31.5%, which is similar to previous years.
Hypertension was more prevalent among men (32%) than women (27%).
The prevalence of hypertension increased with age and was highest among those aged 75 and over for both men (67%) and women (70%). The increase by age was steeper among younger age groups for men than for women.
The proportion of adults with untreated hypertension (SBP at or greater than 140mmHg and/or DBP at or greater than 90mmHg, not currently taking medication for blood pressure), was 12%. This increased with age, from 1% among those aged 16 to 24 to 18% among those aged 75 and over. Untreated hypertension was more common among men (13%) than women (10%).
For more information: Table 9 and Table A4
Note that due to rounding totals may sum to more or less than 100%
Prevalence of hypertension, by area deprivation
The prevalence of hypertension by area deprivation is shown in the tables as age-standardised.
The age-standardised prevalence of hypertension, and untreated hypertension, did not vary by area deprivation.
For more information: Table 10
Trends in hypertension
The prevalence of hypertension among all adults was 31% in 2003 and has remained relatively stable since.
The proportion of adults with untreated hypertension decreased from 2003 to 2024 for both men (20% to 13%) and women (16% to 10%), with some fluctuation across years.
For more information: Table 9
HSE data collection was paused in 2020 due to pandemic-related restrictions, meaning that insufficient data was collected for reporting. There was no annual survey in 2023. Changes to the coding of medications for blood pressure medication in 2024 may have slightly affected comparability of estimates. See note above for further information: Changes in blood pressure medication coding on HSE
Prevalence of doctor-diagnosed and undiagnosed hypertension, by age and sex
Total hypertension is the combination of doctor-diagnosed hypertension and undiagnosed hypertension. It differs from the estimates of ‘all with hypertension’ in Table 9 which includes information from the health visit on blood pressure readings and reporting a doctor-diagnosis. By contrast, the definitions in Table 11 are based on information on blood pressure readings and blood pressure medication.
Note that doctor-diagnosed hypertension may include participants who have reported a diagnosis of hypertension but who do not have high blood pressure readings at the time of the health visit and are not on medication (this could, for example, be a result of them controlling their blood pressure through lifestyle changes). Therefore, estimates of hypertension may be greater using this method.
Total hypertension was recorded for 32% of adults aged 16 and over, with higher prevalence among men (36%) than women (30%). The prevalence of total hypertension increased with age and was highest among those aged 75 and over among both men (70%) and women (72%) but increased more steeply from age 35 among men than among women.
The proportion of adults with undiagnosed hypertension was 9%. This increased with age and was highest among those aged 75 and over (15%).
For more information: Table 11
Prevalence of doctor-diagnosed and undiagnosed hypertension, by region
Hypertension estimates by region are shown in the tables as both observed and age-standardised.
When controlling for age, the proportion of adults with total and undiagnosed hypertension did not vary by region.
For more information: Table 12
Last edited: 27 January 2026 9:34 am