Publication, Part of Health Survey for England
Health Survey for England, 2024
Official statistics, National statistics, Survey, Accredited official statistics
Adults' health-related behaviours
Summary
This report includes results from the 2024 Health Survey for England (HSE) describing cigarette smoking, e-cigarette use, adult alcohol consumption, physical activity, gambling participation and the prevalence of at-risk and problem gambling.
Detailed tables accompanying this report can be accessed here.
Key findings
- Prevalence of current cigarette smoking among adults continued to decline, from 27% in 1993 to 11% in 2024.
- Current e-cigarette use among adults aged 16 and over was 10% in 2024, this is similar to 2022 (9%). These figures represent an increase from earlier years, between 2016 and 2019 6% of adults regularly used e-cigarettes.
- 77% of adults had drunk alcohol in the last 12 months.
- A higher proportion of men than women had drunk alcohol in the last week (50% of men and 38% of women). Men (27%) were also more likely than women (15%) to drink at levels that put them at increasing or higher risk of alcohol-related harm (over 14 units per week).
- 27% of adults were classified as inactive, meaning that they participated in less than 30 minutes of moderate or vigorous activity (MVPA) a week.
- The proportion of adults participating in any form of gambling activities decreased from 65% in 2012 to 48% in 2024.
- Men (52%) were more likely to participate in some form of gambling activity than women (45%). They were also more likely to participate in online gambling activities, when excluding the National Lottery (15% of men; 6% of women).
- 5% of adults had Problem Gambling Severity Index (PGSI) scores of 1 or more, indicating at risk or problem gambling. Men (7%) were more likely to engage in at risk or problem gambling than women (3%).
Smoking
Smoking and health
Smoking is estimated to be one of the leading causes of preventable illness and premature deaths in England. It is highly addictive due to the nicotine contained in tobacco. Tobacco use is a major risk factor for cardiovascular and respiratory diseases, several different types of cancer and many other debilitating health conditions (Source: World Health Organization, 2021).
Actions to reduce the prevalence of smoking have been outlined in the government’s Tobacco Control Plan, published in 2017 (Source: GOV.uk, 2017). In 2019, the government set an objective for England to be smokefree by 2030, meaning only 5% of the population would smoke by then. The Khan Review (Source: GOV.uk, 2022), officially titled ‘Making Smoking Obsolete’, was commissioned in 2022 by the then UK government to provide recommendations on how to achieve a smoke-free society by 2030. Key recommendations included increasing funding for smoking cessation services, raising tobacco taxes, introducing a 'polluter pays' levy on tobacco companies, expanding smoke-free zones, enhancing public health campaigns, reducing the availability of tobacco products, and providing tailored support for vulnerable groups.
Methods and definitions
The analysis categorises participants in one of three ways:
- current smokers, who answered yes to the question: ‘Do you smoke cigarettes at all nowadays?’
- ex-regular smokers, who did not currently smoke but who reported that they had smoked cigarettes, and that they used to smoke regularly (at least once a day)
- never regular smokers, who did not currently smoke, and had either smoked in the past, but only occasionally, or had never smoked cigarettes
These questions were asked during the interview. In 2024, young adults aged 16 to 17 and some aged 18 to 24 answered these questions in a Computer Assisted Self Interview (CASI) to ensure confidentiality.
Cigarette smoking status and consumption, by sex
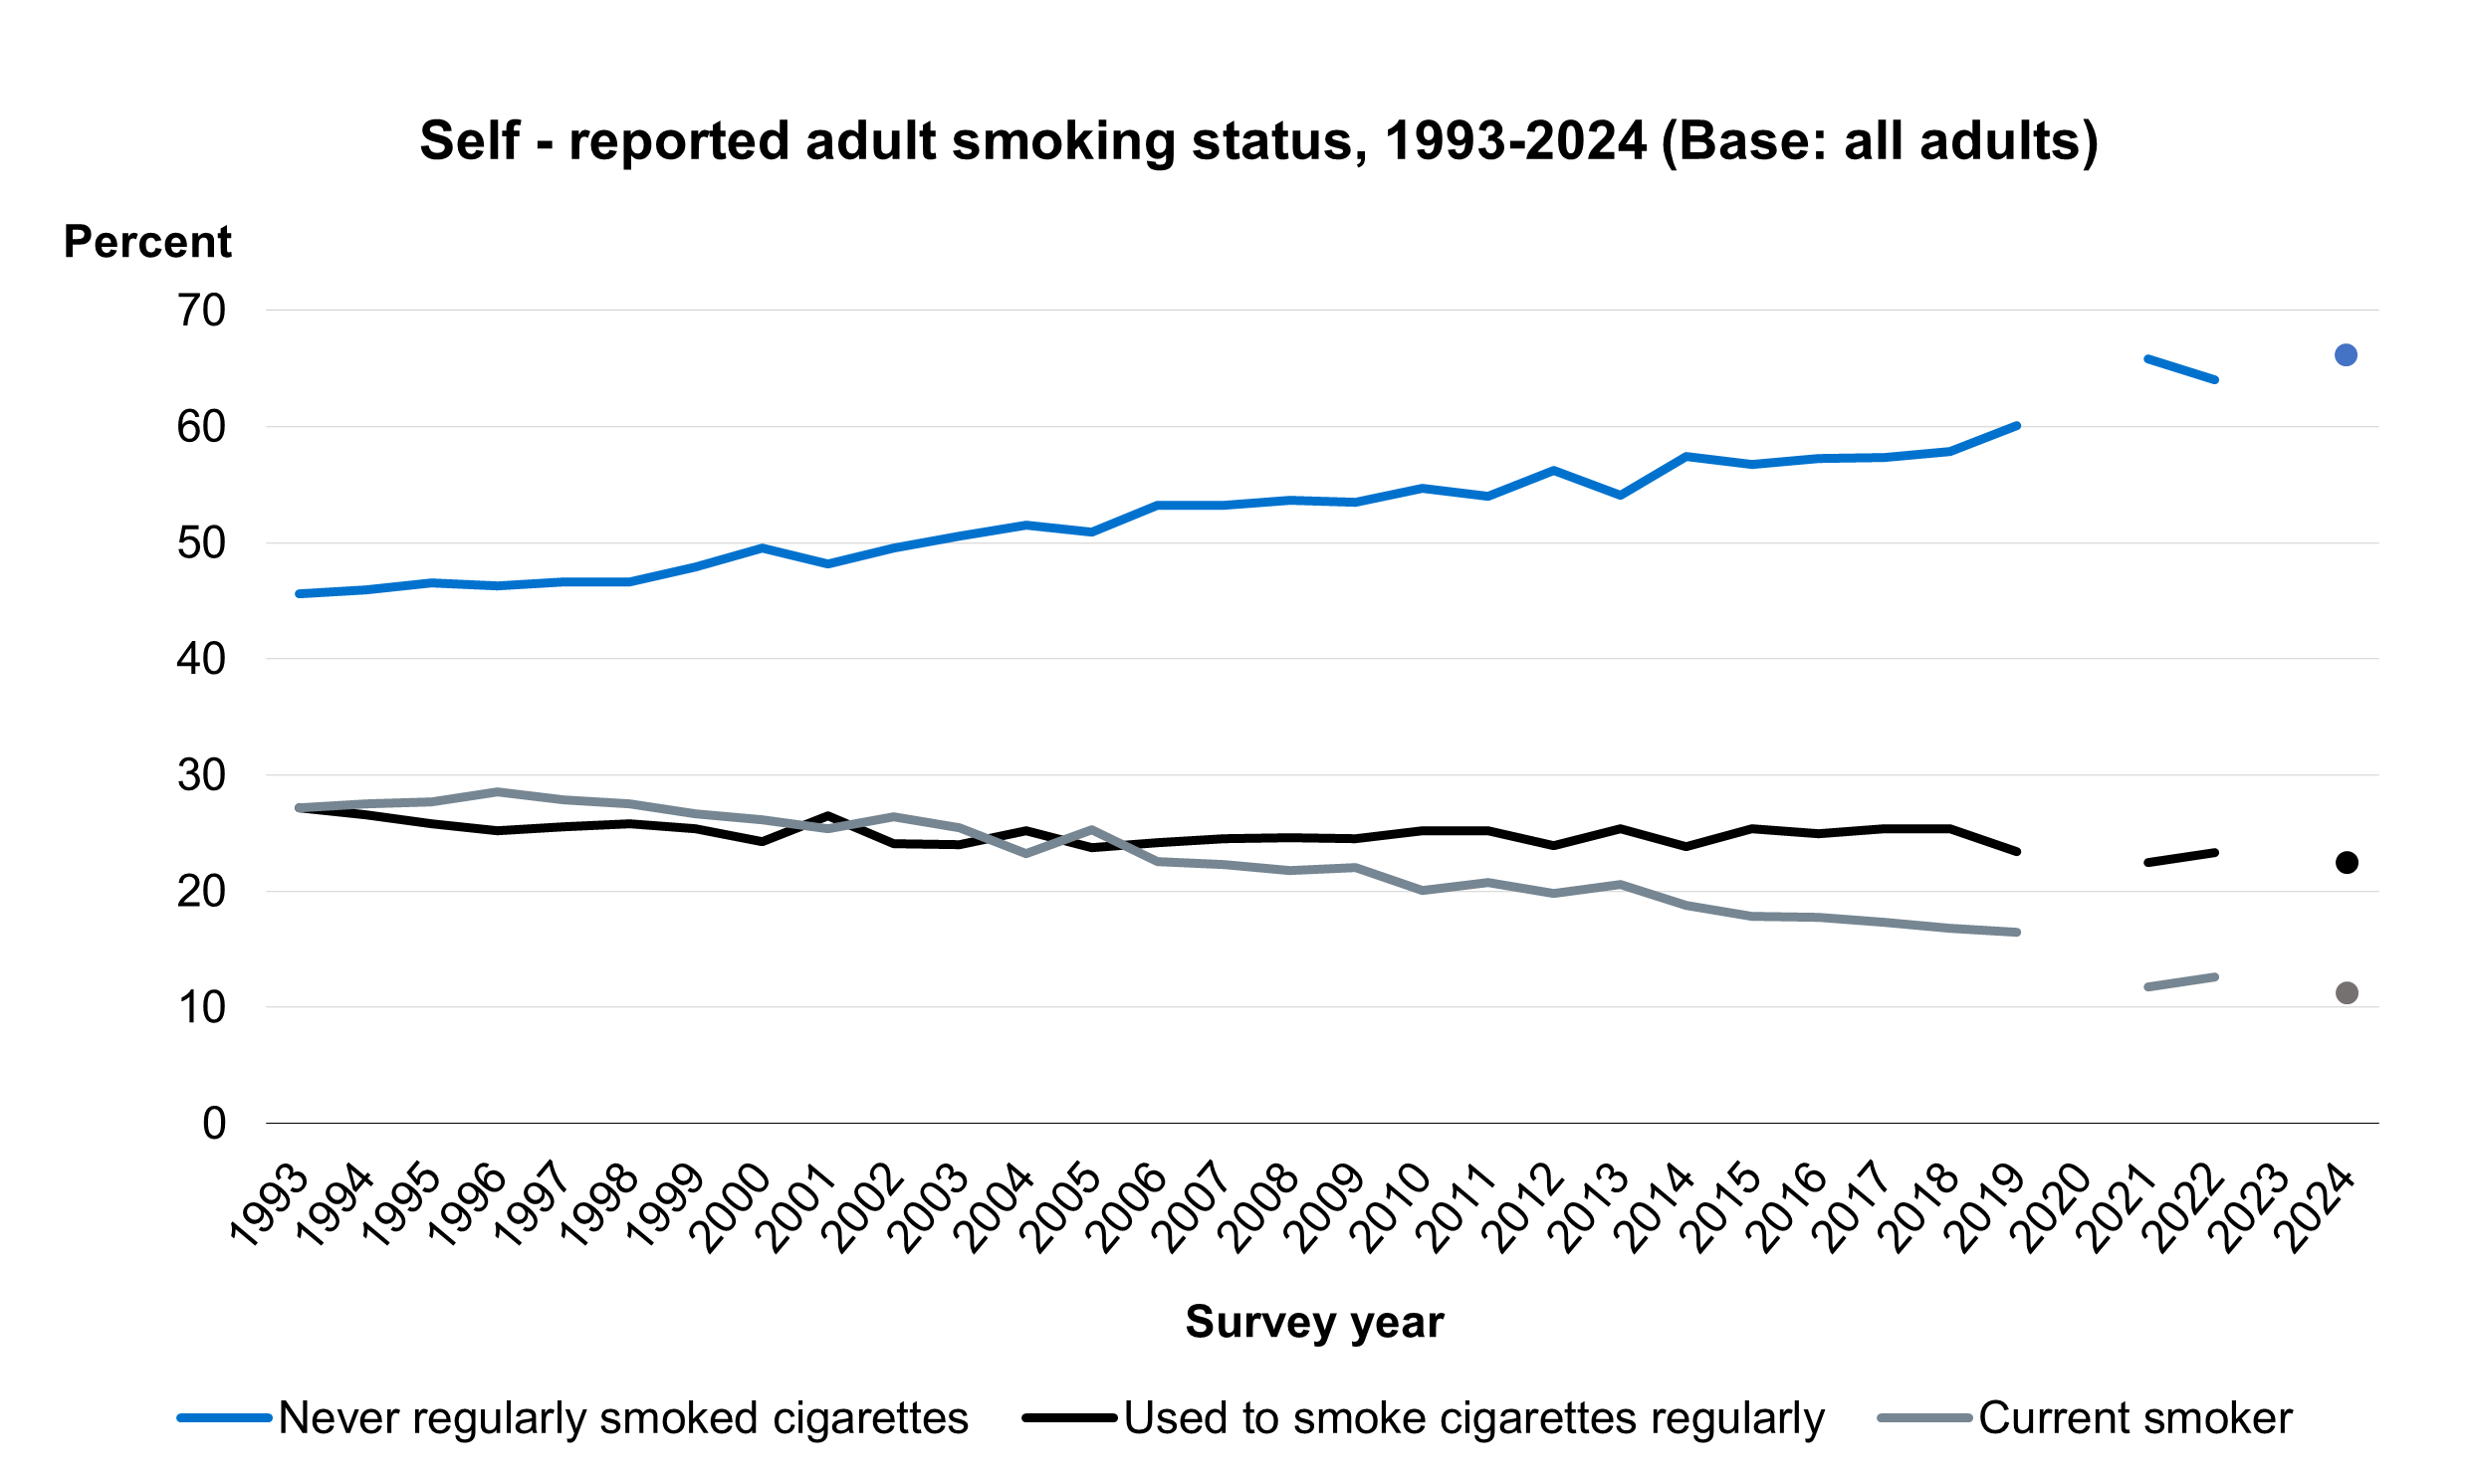
In 2024, 11% of adults aged 16 and over reported currently smoking cigarettes. 23% reported that they used to smoke cigarettes and 66% never regularly smoked cigarettes. Men (13%) were more likely to be current cigarette smokers than women (10%).
In 2024, an estimated 5.3 million adults were current smokers, including 3.0 million men and 2.3 million women.
Current smokers reported smoking an average (median) of 10 cigarettes a day. The median number of cigarettes smoked per day by current smokers gradually decreased from 15 to 10 between 1993 and 2011 and has remained stable since.
2% of current smokers reported smoking 20 or more cigarettes a day. Among adults currently smoking, the average number of cigarettes smoked per day was similar for men and women.
For more information: Table 1 and Table B1
Cigarette smoking status, by age
The proportion of adults currently smoking cigarettes varied by age. Prevalence of current smoking was highest among those aged 55 to 64 (14%) and lowest among those aged 75 and over (4%). The pattern by age was similar for men and women.
For more information: Table 2
Cigarette smoking status, by area deprivation and sex
The proportion of adults who reported current cigarette smoking varied by area deprivation, with higher prevalence in more deprived areas. Current smoking prevalence was 17% in the most deprived areas compared with 7% in the least deprived areas. The pattern in cigarette smoking by area deprivation was similar for men and women.
For more information: Table 3
Trends in cigarette smoking status
The proportion of adults currently smoking cigarettes has decreased over time from 27% in 1993 to 11% in 2024. This includes a recent drop in prevalence rates from 16% of adults being classified as current smokers in 2019 to 11% in 2024. This downwards trend, including the additional drop in prevalence since 2019, was observed among both men (28% in 1993 to 18% in 2019, with a further drop to 13% in 2024) and women (26% in 1993 to 15% in 2019, with a further drop to 10% in 2024). Prevalence of never regularly smoking cigarettes increased from 46% to 66% between 1993 and 2024.
Like previous years, prevalence of current cigarette smoking was lowest among those aged 75 and over (4%). Prevalence fluctuated between 11% and 14% across age groups for those aged between 16 and 64.
For more information: Table 2
Trends in cigarette consumption
The prevalence of smoking 20 or more cigarettes per day gradually decreased from 9% in 1993 to between 2% and 3% during the period from 2014 to 2024.
Note that 2021 data are not directly comparable with other years due to changes in survey methodology and response rates. See the HSE 2021 Methods report for details.
For more information: Table 1
E-cigarette use
E-cigarettes and health
Electronic cigarettes (e-cigarettes) and other vaping devices use a range of methods that allow their users to inhale nicotine as a vapour rather than via tobacco smoke. Their use in Britain has increased in recent years (Source: ASH, 2025).
There are strict regulations on the kind of e-cigarettes and vaping devices that can be sold, and how much nicotine they can contain (Source: GOV.uk). Disposable vapes were banned in 2025 (Source: GOV.uk, 2025). The Khan Review made several key recommendations to leverage e-cigarettes as a tool for smoking cessation. The review suggests promoting vaping as a less harmful alternative to smoking traditional cigarettes. It advocates for clear and consistent public health messaging to inform smokers about the relative safety of vaping compared to smoking. Additionally, the review recommends improving access to vaping products for smokers looking to quit, including potentially making them available through the National Health Service (NHS). It also calls for continued research into the long-term health effects of vaping to ensure ongoing safety and efficacy monitoring. These recommendations aim to reduce smoking rates while ensuring that non-smokers, particularly young people, are not encouraged to start vaping (Source: GOV.uk, 2022)
Methods and definitions
This report uses the term e-cigarette to refer to all vaping devices.
The current HSE questions about e-cigarette use were asked between 2016 and 2024. Participants were asked whether they had ‘ever used an electronic cigarette (e-cigarette), or any other vaping device?’ Interviewers offered further clarification if necessary. Those who said that they had ever used e-cigarettes were asked whether they used e-cigarettes or vaping devices at all nowadays. Note that in this analysis current and past users include adults who have only used e-cigarettes once or twice.
E-cigarette use, by age and sex
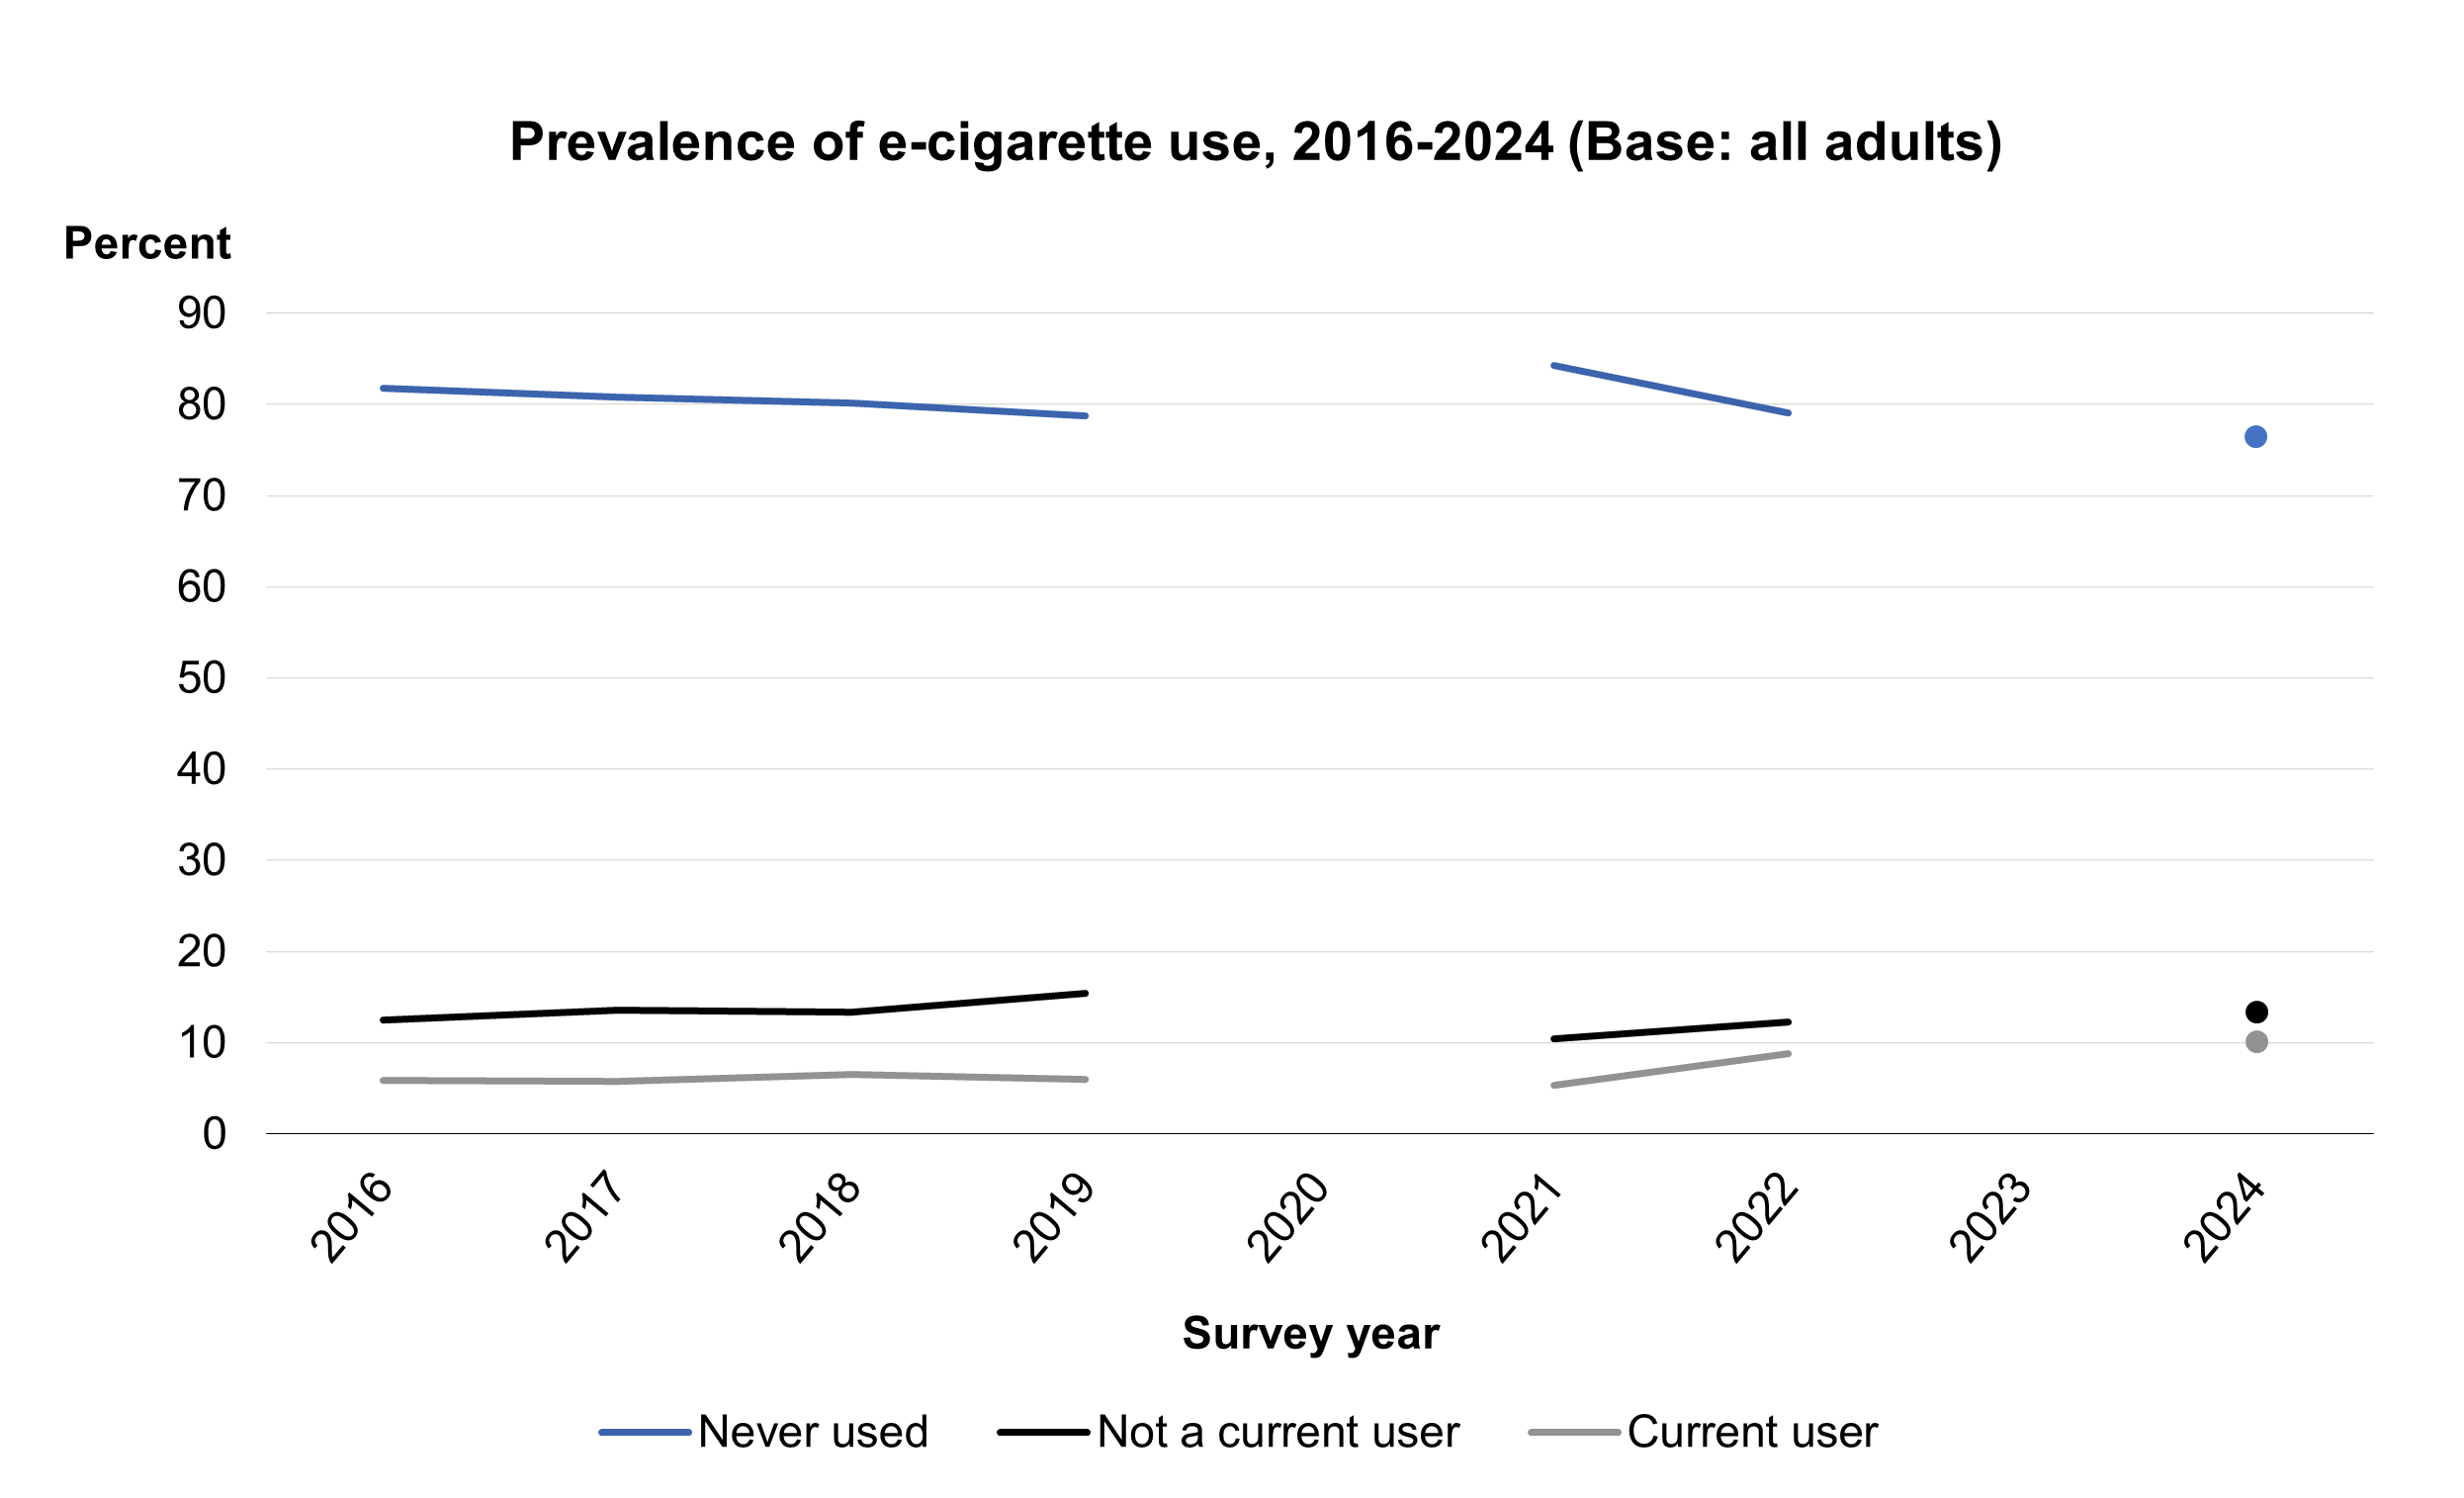
Current e-cigarette use in 2024 was similar to 2022 (9%). In 2024, 10% of adults aged 16 and over reported currently using e-cigarettes and 13% reported they had tried e-cigarettes but were not currently using them. 76% of adults reported never having used e-cigarettes.
The proportion of adults using e-cigarettes decreased with age, from 18% among those aged 16 to 24 to 2% among those aged 75 and over. The prevalence of currently using e-cigarettes was similar between men (11%) and women (9%).
For more information: Table 4
E-cigarette use, by cigarette smoking status
E-cigarette use was more common among adults who were current smokers or ex-smokers than among adults who had never smoked: 25% of current cigarette smokers also currently used e-cigarettes, as did 21% of ex-regular cigarette smokers, and 4% of those who had never smoked cigarettes.
Prevalence of current e-cigarette use among those currently smoking cigarettes was similar for men and women.
For more information: Table 5
E-cigarette use, by region and sex
E-cigarette use estimates by region are shown in the tables as both observed and age-standardised.
The prevalence of current e-cigarette use was similar across regions.
For more information: Table 6
E-cigarette use, by area deprivation and sex
The proportion of adults who reported currently using e-cigarettes did not vary by area deprivation.
For more information: Table 7
Trends in e-cigarette use
Reported current e-cigarette use remained stable at 6% between 2016 and 2019 and since increased to 10% by 2024. This upwards trend was observed among both men and women. Among men, the prevalence of current e-cigarette use fluctuated between 6% and 8% during the period 2016 to 2019 before increasing to 11% in 2024. Among women, prevalence was 5% between 2016 and 2019, then increased to 9% in 2024.
The proportion of adults who had never used e-cigarettes decreased from 82% in 2016 to 76% in 2024.
For more information: Table 4
Drinking alcohol
Alcohol and health
The health risks associated with drinking alcohol include accidents, injuries, cancer, heart disease and reduced life expectancy (Source: Department of Health, 2016). These risks tend to increase with higher consumption.
Since 2016, UK guidelines have focused on regular weekly consumption, with the recommendation that men and women should not normally consume more than 14 units of alcohol a week, and that this should include some days where no alcohol is consumed (Source: Department of Health, 2016). Guidance on single drinking episodes focuses on reducing risks rather than specific quantities.
How alcohol consumption is measured
The HSE has asked about drinking alcohol since it began in 1993. Since 2011, the questionnaire has included the following areas, covered by this report:
- frequency of drinking in the last 12 months (including those who never drink)
- frequency of drinking different types of drink and the amounts of each drunk on a typical day in the last 12 months (providing average weekly consumption)
- number of drinking days in the last week
- the amounts of different types of alcohol drunk on the day they drank most (‘maximum amount drunk on any day in the last week’)
These questions were asked as part of the interview. In 2024, all young adults aged 16 to 17, and some aged 18 to 24, answered these questions in a Computer Assisted Self Interview (CASI) to ensure confidentiality.
The Alcohol Use Disorders Identification Test (AUDIT) questionnaire was used to assess problem drinking. To ensure confidentiality, all adults aged 16 and over were asked the AUDIT questions in an online Computer Assisted Web Survey (CAWI) or by CASI.
Alcohol consumption is reported in terms of units of alcohol; one unit of alcohol is 10ml by volume of pure alcohol (alcohol by volume – ABV).
Note that the methodology used to estimate the number of units of alcohol changed in 2006 and 2022 and since 2022, revised alcohol conversion factors have been applied. Findings relating to alcohol consumption from the 2022 and 2024 surveys are therefore not directly comparable with previous HSEs.
Definitions
The HSE measures average weekly consumption and does not take into account varying patterns of consumption, for example, at different times of year. By definition, it does not reflect occasions when consumption might be higher or lower than usual, for instance, holidays, celebrations or periods of fasting.
Measures of usual weekly consumption are presented in line with the current guidelines for sensible drinking:
- lower risk (up to 14 units for men and women)
- increasing risk (above 14 and up to 50 units for men, above 14 and up to 35 units for women)
- higher risk (above 50 units a week for men, above 35 units for women)
Frequency of drinking alcohol in the last 12 months, by age and sex
In 2024, 77% of adults aged 16 and over reported that they had drunk alcohol in the last 12 months, and 44% reported that they drank alcohol at least once a week.
A higher proportion of men than women had drunk alcohol in the last 12 months (78% of men and 75% of women). Men were also more likely than women to report they had drunk alcohol in the last week (50% and 38% respectively).
The proportion of adults who drank alcohol in the last 12 months varied by age, with different patterns observed for men and women.
- Among men the proportion who had drunk alcohol in the last 12 months increased with age from 64% among those aged 16 to 24 to 86% among those aged 55 to 64, remaining at a similar level (84%) among those aged 65 and over.
- Among women the proportion who had drunk alcohol in the last 12 months increased with age, with some fluctuations, from 72% among those aged 16 to 24 to 83% among those aged 55 to 64 before decreasing to 71% among those aged 75 and over.
For both men and women, the proportion drinking at least once a week increased with age, from 30% among adults aged 16 to 24 to 55% among those aged 55 to 74, then decreased to 48% among those 75 and over.
For more information: Table 8
Estimated weekly alcohol consumption, by age and sex
Estimates in this section are based on typical alcohol consumption across the year and do not represent consumption in any specific week.
In 2024, 24% of adults had not drunk alcohol in the last 12 months. 55% of adults drank at levels that put them at lower risk of alcohol-related harm (14 units or less per week) while 16% drank at levels that put them at increasing risk and 4% at higher risk (more than 14 units per week).
There were some differences between men and women in typical weekly alcohol consumption, with women more likely than men to drink at lower levels or to not drink.
- 22% of men and 26% of women did not drink alcohol in the last 12 months. Among men, the proportion who had not drunk alcohol in the last 12 months decreased with age, from 39% of those aged 16 to 24 to 17% of those aged 75 and over. Among women, the highest proportions of non-drinkers were observed among those aged 16 to 24 (31%) and those aged 75 and over (30%), while the lowest proportion of non-drinkers was among those aged 55-64.
- 51% of men and 60% of women drank at levels that put them at lower risk of alcohol-related harm.
- Across all age groups a higher proportion of men (27%) than women (15%) drank at increasing or higher risk levels (over 14 units per week).
- 5% of men drank over 50 units a week and 3% of women drank over 35 units a week (higher risk levels).
The proportion of adults who drank at increasing or higher risk levels (over 14 units per week) varied by age, with the highest prevalence observed among those aged 65 to 74 (29%) and the lowest among those aged 25 to 34 (14%).
In 2024, an estimated 11.2 million adults had not drunk alcohol in the last 12 months. 25.9 million adults drank at recommended (lower risk) levels.
For more information: Table 10 and Table B2
Trends in frequency of drinking alcohol in the last 12 months
The proportion of adults who had not drunk alcohol in the last 12 months increased from 19% in 2022 to 24% in 2024. Prior to 2024 this proportion had remained stable since 2011, fluctuating between 17% and 20%.
Different trends were observed for men and women, with no change over time observed in the proportion of women who had not drunk alcohol in the last 12 months. The trend among men was similar to that observed for all adults, with an increase in the proportion who had not drunk alcohol in the last 12 months since 2022 (from 17% in 2022 to 22% in 2024, following a period of minor fluctuations, between 14% and 17%, since 2011.
HSE 2021 figures were not included in trend analysis due to changes in survey methodology and response rates. See the HSE 2021 Methods report for details.
For more information: Table 9
Estimated weekly alcohol consumption, by region and sex
Regional data are shown in the data tables, both as observed and age-standardised estimates.
There were differences in weekly alcohol consumption between regions. After controlling for age, the highest proportion of adults who had not drunk alcohol in the last 12 months was in the West Midlands (36%) while the lowest was in the South West (17%).
The proportion of adults who drank more than 14 units per week also varied across regions. After controlling for age, the highest proportion of adults drinking at increasing or higher risk levels was in Yorkshire and the Humber (28%) while the lowest was in the West Midlands (13%).
For more information: Table 11
Estimated weekly alcohol consumption, by area deprivation and sex
Data has been age-standardised to take into account different age profiles across different IMD.
The proportion of non-drinkers varied by area deprivation, with the proportion of non-drinkers increasing with level of area deprivation, from 16% in the least deprived areas to 39% in the most deprived areas.
The proportion of adults drinking at increasing or higher risk (over 14 units of alcohol a week) also varied by area deprivation, with the lowest proportion, 14%, in the most deprived areas and the highest proportions, ranging from 22% to 23%, in areas within the three least deprived quintiles.
For more information: Table 12
Number of days on which drank alcohol in the last week, by age and sex
51% of adults reported drinking alcohol in the last week and 9% of adults drank alcohol on five or more days. A higher proportion of men (56%) than women (46%) drank alcohol in the last week and men (11%) were more likely than women (7%) to have drunk alcohol on five or more days in the last week.
The proportion of adults who reported drinking alcohol in the last week varied by age, with different patterns observed for men and women. Among men the proportion who had drunk in the last week increased from 39% of those aged 16 to 24 to 65% of those aged 65 to 74. 61% of men aged 75 and over had drunk alcohol in the last week. Among women the proportion was stable (between 40% and 42%) among those aged between 16 and 44, then increased to 55% among those aged 55 to 64 before dropping to 43% among those aged 75 and over.
The proportion of adults who drank alcohol on five or more days in the last week increased from 2% of adults aged 16 to 34 to 19% of those aged 75 and over. This pattern was similar for men and women.
The mean number of days on which adults drank alcohol in the last week was 2.7 and was higher among men than women (2.9 days and 2.6 days respectively). The mean number of days increased with age, fluctuating between 1.9 and 2.2 among those aged 16 to 44 before increasing gradually to 3.7 days among those aged 75 and over.
For more information: Table 13
Estimated maximum alcohol consumption on any day in the last week, by age and sex
In 2024, 30% of adults drank more than the recommended daily limit – that is, drinking more than three units (women) or four units (men) on a single day. This is similar to the level observed in 2022.
Men (34%) were more likely than women (27%) to do so. Furthermore, the proportion who drank more than three units (women) or four units (men) on any day in the last week varied with age, with those aged 55 to 64 most likely to do so (39%) and those aged 75 and over least likely (18%).
For more information: Table 14
Problem drinking according to the Alcohol Use Disorders Identification Test (AUDIT)
The Alcohol Use Disorders Identification Test (AUDIT) is a questionnaire used to assess problem drinking. AUDIT is widely considered to be the best screening tool for detecting problematic alcohol use. It comprises ten indicators of problem drinking: three indicators of consumption, four of use of alcohol considered harmful to oneself or others, and three of physical dependency on alcohol. In line with the World Health Organisation (WHO) guidelines on using the test, responses to each of the ten AUDIT questions were assigned values of between 0 and 4. Scores for the ten questions were summed to form a scale, from 0 to 40, of alcohol use.
In addition to alcohol consumption, the AUDIT questionnaire includes questions measuring the social impact of alcohol consumption, harm caused by excessive drinking and whether friends or health professionals have suggested a need to cut down. The questionnaire, scoring and interpretation guidelines can be found on the GOV.uk website.
The WHO guidelines for interpreting AUDIT scale scores are set out in Table B.
| Score | Category description |
| 0 to 7 | Low risk drinking behaviour, or abstinence |
| 8 to 15 | Medium level of alcohol problems, with increased risk of developing alcohol-related health or social problems (sometimes described as hazardous drinking behaviour) |
| 16 to 19 | High level of alcohol problems, for which counselling is recommended (harmful drinking behaviour) |
| 20 or above | Warrants further investigation for possible alcohol dependence |
This report uses the term at-risk drinking behaviour to refer to a score of 8 or above on the AUDIT.
Prevalence of at-risk drinking behaviour, by age and sex
In 2024, 89% of all adults were categorised as having low risk drinking behaviour (or abstinence), according to AUDIT. Women (93%) were more likely than men (85%) to have low risk drinking behaviour.
9% of adults had AUDIT scores indicating increasing risk drinking behaviour, 1% had scores indicating higher risk drinking behaviour and 1% had scores indicating possible alcohol dependence. A higher proportion of men than women were classified as being at increasing risk, higher risk or possible alcohol dependence (15% of men and 7% of women).
Prevalence of at-risk drinking behaviour varied by age. The proportion classified as having low risk drinking behaviour increased with age, from 83% among those aged 16 to 24 to 94% among those aged 65 and over. Conversely, the proportion with an AUDIT score indicating increasing risk, higher risk or possible alcohol dependence decreased with age, from 17% among those aged 16 to 24 to 6% among those aged 65 and over.
For all adults, the average (mean) AUDIT score was 4.4. Men had a higher average (mean) AUDIT score than women (5.0 compared with 3.9). Average (mean) AUDIT score also varied by age: it was highest among those aged 16 to 24 (5.8) and lowest among those aged 65 and over (3.5).
For more information: Table 15
Prevalence of at-risk drinking behaviour, by area deprivation and sex
The prevalence of at-risk alcohol consumption according to AUDIT did not vary by area deprivation.
For more information: Table 16
Physical activity
Physical activity and health
In 2011, the Chief Medical Officers for the four UK countries published revised guidelines for physical activity, outlining the levels of activity and type of activity needed to benefit health. Updates to these guidelines were published in 2019 with differing recommendations for each age group, for muscle strengthening activities, aerobic activity and balance activities (Source: GOV.uk, 2019). The recommendations indicated that the overall volume of physical activity is more important for health than specific types of activities or frequency of sessions.
Methods and definitions
In HSE 2024, information on physical activity was collected using the Short-Form International Physical Activity Questionnaire (IPAQ). This questionnaire defines activity levels based on reported moderate or vigorous physical activity (MVPA). Participants reporting below 30 minutes MVPA per week were defined as ‘inactive’ whereas those reporting 30 minutes or more MVPA per week were defined as ‘active’. This definition is comparable to physical activity as reported using IPAQ in HSE 2022. Note that this definition differs from the UK Chief Medical Officers' Physical Activity Guidelines for sufficient levels of aerobic activity (at least 150 minutes/week of MVPA).
Physical activity, by age and sex
In 2024, 27% of adults were classified as ‘inactive’, that is, they reported participating in less than 30 minutes of moderate or vigorous physical activity (MVPA) per week.
A similar proportion of men (26%) and women (28%) were classified as inactive.
Patterns in inactivity by age varied between men and women. Among men, inactivity increased with age from 19% among those aged 16 to 34 to 45% among those 75 and over. Among women, 30% of those in the youngest age group (16 to 24) were inactive, then fluctuated between 22% and 26% of those aged between 25 and 74 before increasing to 50% among those aged 75 and over. Among both men and women, those aged 75 and over were most likely to be inactive.
For more information: Table 17
Physical activity, by area deprivation
Data has been age-standardised to take into account different age profiles across different IMD quintiles.
Inactivity among adults varied by area deprivation, with those in the most deprived areas more likely to be inactive. 41% of adults in the most deprived areas were inactive compared with between 22% and 24% in areas in the three least deprived quintiles.
For more information: Table 18
Physical activity, by Body Mass Index (BMI) and sex
To define overweight or obesity, a measurement is required that allows for differences in weight due to height. Body mass index (BMI), defined as weight in kilograms divided by the square of the height in metres (kg/m2), is used for this purpose in the HSE series.
Inactivity levels varied by BMI category. 30% of adults who were living with obesity were inactive compared with 20% who were healthy weight and 23% who were overweight.
For more information: Table 19
Gambling behaviour
Gambling behaviour and health
Gambling regulation in England has been shaped by the Gambling Act 2005, which set out principles for fair conduct, crime prevention, and protection of vulnerable groups (Source: GOV.uk, 2005). In response to the rise of online gambling, the Government launched a review of the Act in December 2020 to ensure it remained effective in the digital age (Source: GOV.uk, 2020). Following consultation, the April 2023 White Paper, ‘High Stakes: Gambling Reform for the Digital Age’, proposed updated regulations focused on online protections, marketing, and advertising. These reforms aim to strengthen consumer safeguards and modernise the legislative framework (Source: GOV.uk, 2023).
Despite this, Great Britain has one of the most accessible gambling markets in the world. Opportunities to gamble exist on most high streets and, with access to the internet, in virtually every home. Concerns regarding the harms associated with gambling have been increasing in the UK in recent years and gambling is viewed as a public health issue (Source: GOV.uk, 2019).
Methods and definitions
In HSE 2024, participation in gambling activities was defined as having spent money on any of nineteen specific gambling activities, set out in Table D. The activities are also listed in the HSE 2024 survey documentation, available on the first page. Questions about gambling were asked in a self-completion module.
| Category | Activities |
| Lotteries and related products | National Lottery Draws |
| Scratchcards | |
| Other lotteries | |
| Machines/games | Football pools |
| Bingo (not online) | |
| Slot machines | |
| Machines in a bookmakers | |
| Casino table games (not online) | |
| Poker in a pub tournament, league or club | |
| Online gambling on slots, casino or bingo games | |
| Betting activities | Online betting with a bookmaker |
| Betting exchange | |
| Horse races (not online) | |
| Dog races (not online) | |
| Sports events (not online) | |
| Other events (not online) | |
| Spread-betting | |
| Private betting | |
| Other gambling activity | Any other gambling |
Participation in online gambling on slots, casino or bingo games, online betting with bookmaker or using a betting exchange was classified as participation in online gambling activities.
HSE 2024 uses the Problem Gambling Severity Index (PGSI) to measure problem gambling. Problem gambling is gambling behaviour that creates negative consequences for the gambler, others in his or her social network, or for the community (Source: Ferris et al, 2001). The PGSI was designed for use among the general population rather than within a clinical context. It was developed, tested and validated within a general population survey of over 3,000 Canadian residents. The instrument itself has been subject to critical evaluation and was revised in 2003.
The PGSI consists of nine items ranging from ‘chasing losses’ to ‘gambling causing health problems’ to ‘feeling guilty about gambling’. Each item is assessed on a four-point scale: never, sometimes, most of the time, almost always. Responses to each item are given the following scores: never = 0; sometimes = 1; most of the time = 2; almost always = 3. When scores to each item are summed, a total score ranging from 0 to 27 is possible.
A PGSI score of 8 or more indicates problem gambling, by which a person will have experienced adverse consequences from their gambling and may have lost control of their behaviour. Involvement in gambling can be at any level but is likely to be heavy. This is the threshold recommended by the developers of the PGSI and the threshold used in this report. The PGSI was also developed to give further information on sub-threshold problem gambling. PGSI scores between 3 and 7 are indicative of moderate risk gambling and a score of 1 or 2 is indicative of low-risk gambling.
Participation in gambling activities in the last 12 months, by age and sex
In 2024, 48% of adults aged 16 and over had participated in at least one type of gambling activity in the last 12 months. Survey estimates are subject to a margin of error. It is likely that the proportion of adults in the population who participated in any gambling activities in the past year was between 46.5% and 50.2%. This proportion fell to 37% when gambling on the National Lottery was excluded. 10% of adults reported participating in any online gambling in the last 12 months, excluding National Lottery participation.
The most popular gambling activities were:
- tickets for National Lottery Draw (31%)
- tickets for other lotteries (16%)
- scratchcards (13%)
- online betting with a bookmaker (7%)
- betting on horse races at a bookmaker, by phone or at a racecourse (6%)
All other gambling activities had participation rates of 5% or below.
In 2024, men (52%) were more likely to participate in some form of gambling activity than women (45%).
Men (15%) were also more likely than women (6%) to participate in online gambling activities, when excluding the National Lottery.
The prevalence of gambling participation varied between age groups, increasing from 31% among those aged 16 to 24 to 58% among those aged 55 to 64. It is worth noting that in the UK, all types of gambling are illegal for those aged under 18 and this will affect gambling prevalence in the 16 to 24 age group.
Participation in online gambling was most prevalent among those aged 25 to 34 (15%) and least prevalent among those aged 75 and over (2%).
For more information: Table 22 and Table A5
Participation in gambling activities in the last 12 months, by region and sex
Gambling participation data by region is shown as age-standardised.
When controlling for age, the proportion of adults participating in any gambling activity did not vary by region.
Online gambling rates varied between regions. When adjusting for age, the proportion of adults who had participated in online gambling activities in the last 12 months, excluding the National Lottery, was highest in the North East (14%) and lowest in London (6%).
When looking at both online and offline forms of gaming and taking age differences into account, the rates of adults participating in any form of gambling activities were similar across regions.
For more information: Table 23
Participation in gambling activities in the last 12 months, by survey year and sex
The proportion of adults participating in any form of gambling decreased over time, from 65% in 2012 to 48% in 2024. This downward trend was observed among both men (from 68% in 2012 to 52% in 2024) and women (from 61% in 2012 to 45% in 2024) and across all age groups.
A decrease was also observed in the proportion of adults who participated in gambling excluding the National Lottery – from 43% in 2012 to 37% in 2024. A decrease was observed among both men (from 46% in 2012 to 38% in 2024) and women (from 40% in 2012 to 35% in 2024).
Conversely, the proportion of adults taking part in online gambling (excluding National Lottery) has increased since 2012, from 7% in 2012 to 10% in 2024. There was an increase in the proportion who participated in online gambling activities among both men (from 10% in 2012 to 15% in 2024) and women (from 4% in 2012 to 6% in 2024).
For more information: Table 20
Problem Gambling Severity Index (PGSI), by survey year, age and sex
In 2024, 5% of adults had PGSI scores of 1 or more, indicating at risk or problem gambling. Prevalence in the wider population is likely to be between 4.3% and 5.8%, referred to as the 95% confidence interval (95% CI). 3% of adults had a score of 1 or 2 (indicative of low-risk gambling), 1% had a score of between 3 and 7 (indicative of moderate risk gambling) and less than 1% had a score of 8 or more (indicative of problem gambling).
Men (7%) were more likely to engage in at risk or problem gambling (PGSI score of 1 or more) than women (3%). The proportion of adults who engaged in at risk or problem gambling decreased with age from 9% of those aged 16 to 24 to 1% of those aged 65 and over.
The prevalence of at risk or problem gambling among adults remained stable between 2012 and 2024 (5% in both 2012 and 2024).
For more information: Table 21 and Table A6
Problem Gambling Severity Index (PGSI), by region and sex
The prevalence of at risk and problem gambling using PGSI scores did not vary by region.
For more information: Table 24
Last edited: 27 January 2026 9:34 am