Publication, Part of Health Survey England Additional Analyses
Health Survey England Additional Analyses, Ethnicity and Health, 2011-2019 Experimental statistics
Experimental statistics, Official statistics in development
Wellbeing
Wellbeing is not just the absence of ill health. It includes the way that people feel about themselves and their lives. In the absence of a singular definition, it is generally thought to be made up of things like the experience of positive emotions, people’s perceptions that the things they do in their lives are meaningful and worthwhile, and life satisfaction. Wellbeing is influenced by physical and mental health and in turn has an influence on the experience and outcomes of different health conditions.1
Cross-cultural validation of the WEMWBS within the UK has been limited.2 Differences between ethnic groups may be influenced by social, cultural or economic differences between groups rather than reflecting true variations in wellbeing.
How is wellbeing measured?
Wellbeing in the Health Survey for England (HSE) is primarily measured using the 14-item Warwick Edinburgh Mental Well-Being Scale (WEMWBS).3 These questions were included in the HSE in 2011, between 2013 and 2016, and in 2019. The questions are included in the self-completion booklet.4
WEMWBS comprises 14 statements which cover different aspects of wellbeing expressed positively – for example, ‘I've been feeling optimistic about the future’. Participants are asked to choose the answer that best describes their experience over the previous two weeks: ‘None of the time’, ‘Rarely’, ‘Some of the time’, ‘Often’, or ‘All of the time’ and this scale is scored from 1 to 5. The total Wellbeing score can range from 14 to 70.
WEMWBS scores are presented as means, medians and as the 10th and 90th centiles.5 They are not further classified into categories.
4 https://files.digital.nhs.uk/48/EF1F56/HSE19-Survey-documentation-rep.pdf
5 Centiles are values of a distribution that divide it into 100 equal parts. For example, the 10th centile is the value of a distribution where 10% of the cases have values at or below the 10th centile and 90% have values above it. The median is the 50th centile.
Trends in wellbeing in England: 2011 to 2019
Between 2011 and 2019, average (mean) wellbeing scores were slightly higher among men than among women.
Mean scores were generally stable across the period, between 50.1 and 52.6 among men and between 49.6 and 52.3 among women.
Wellbeing and ethnicity
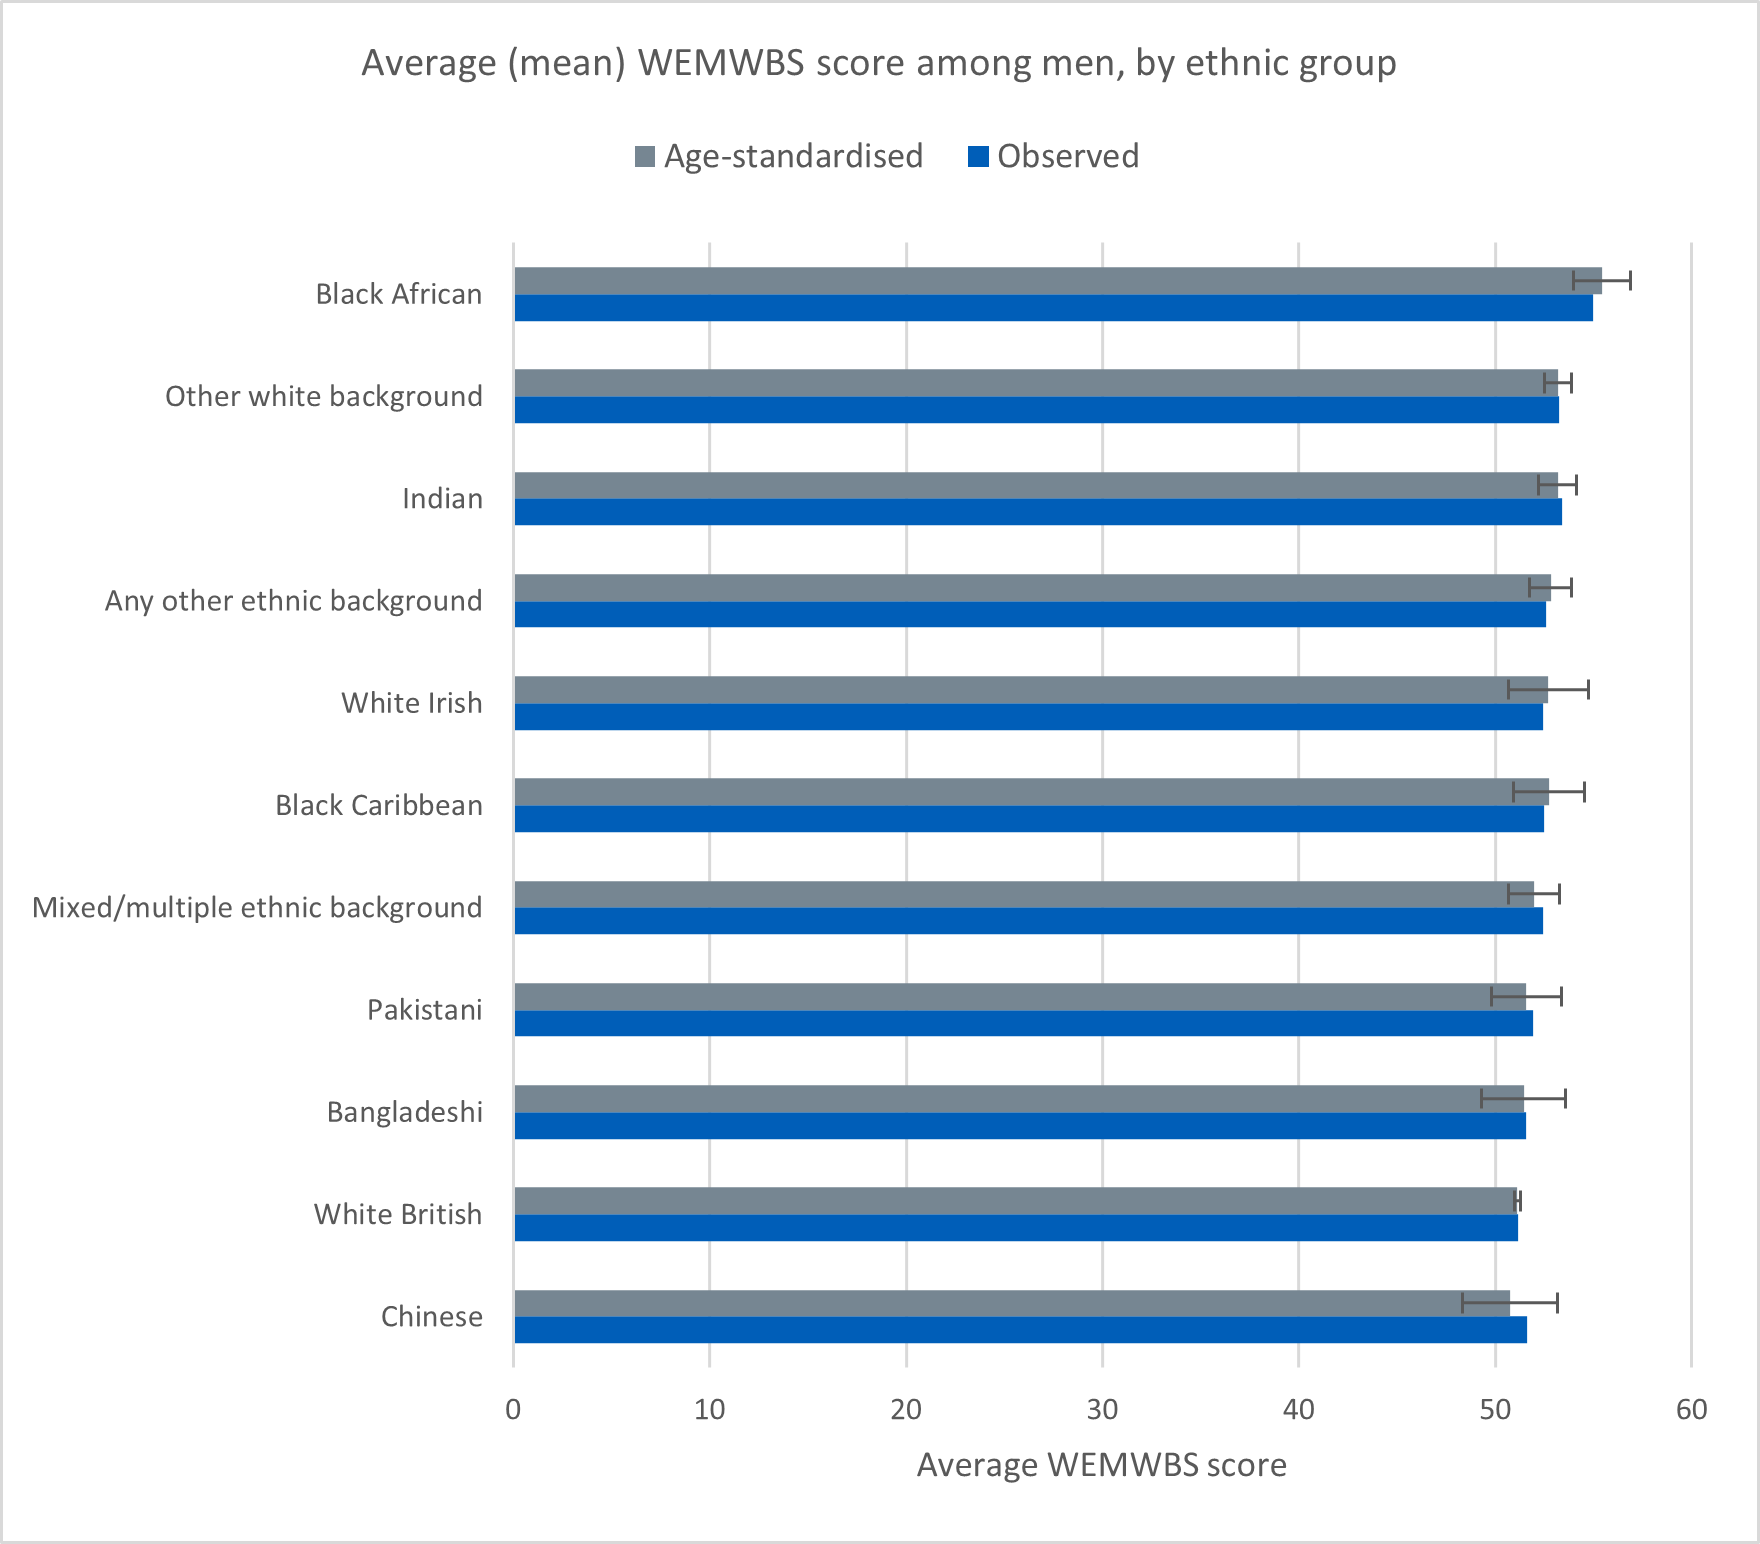
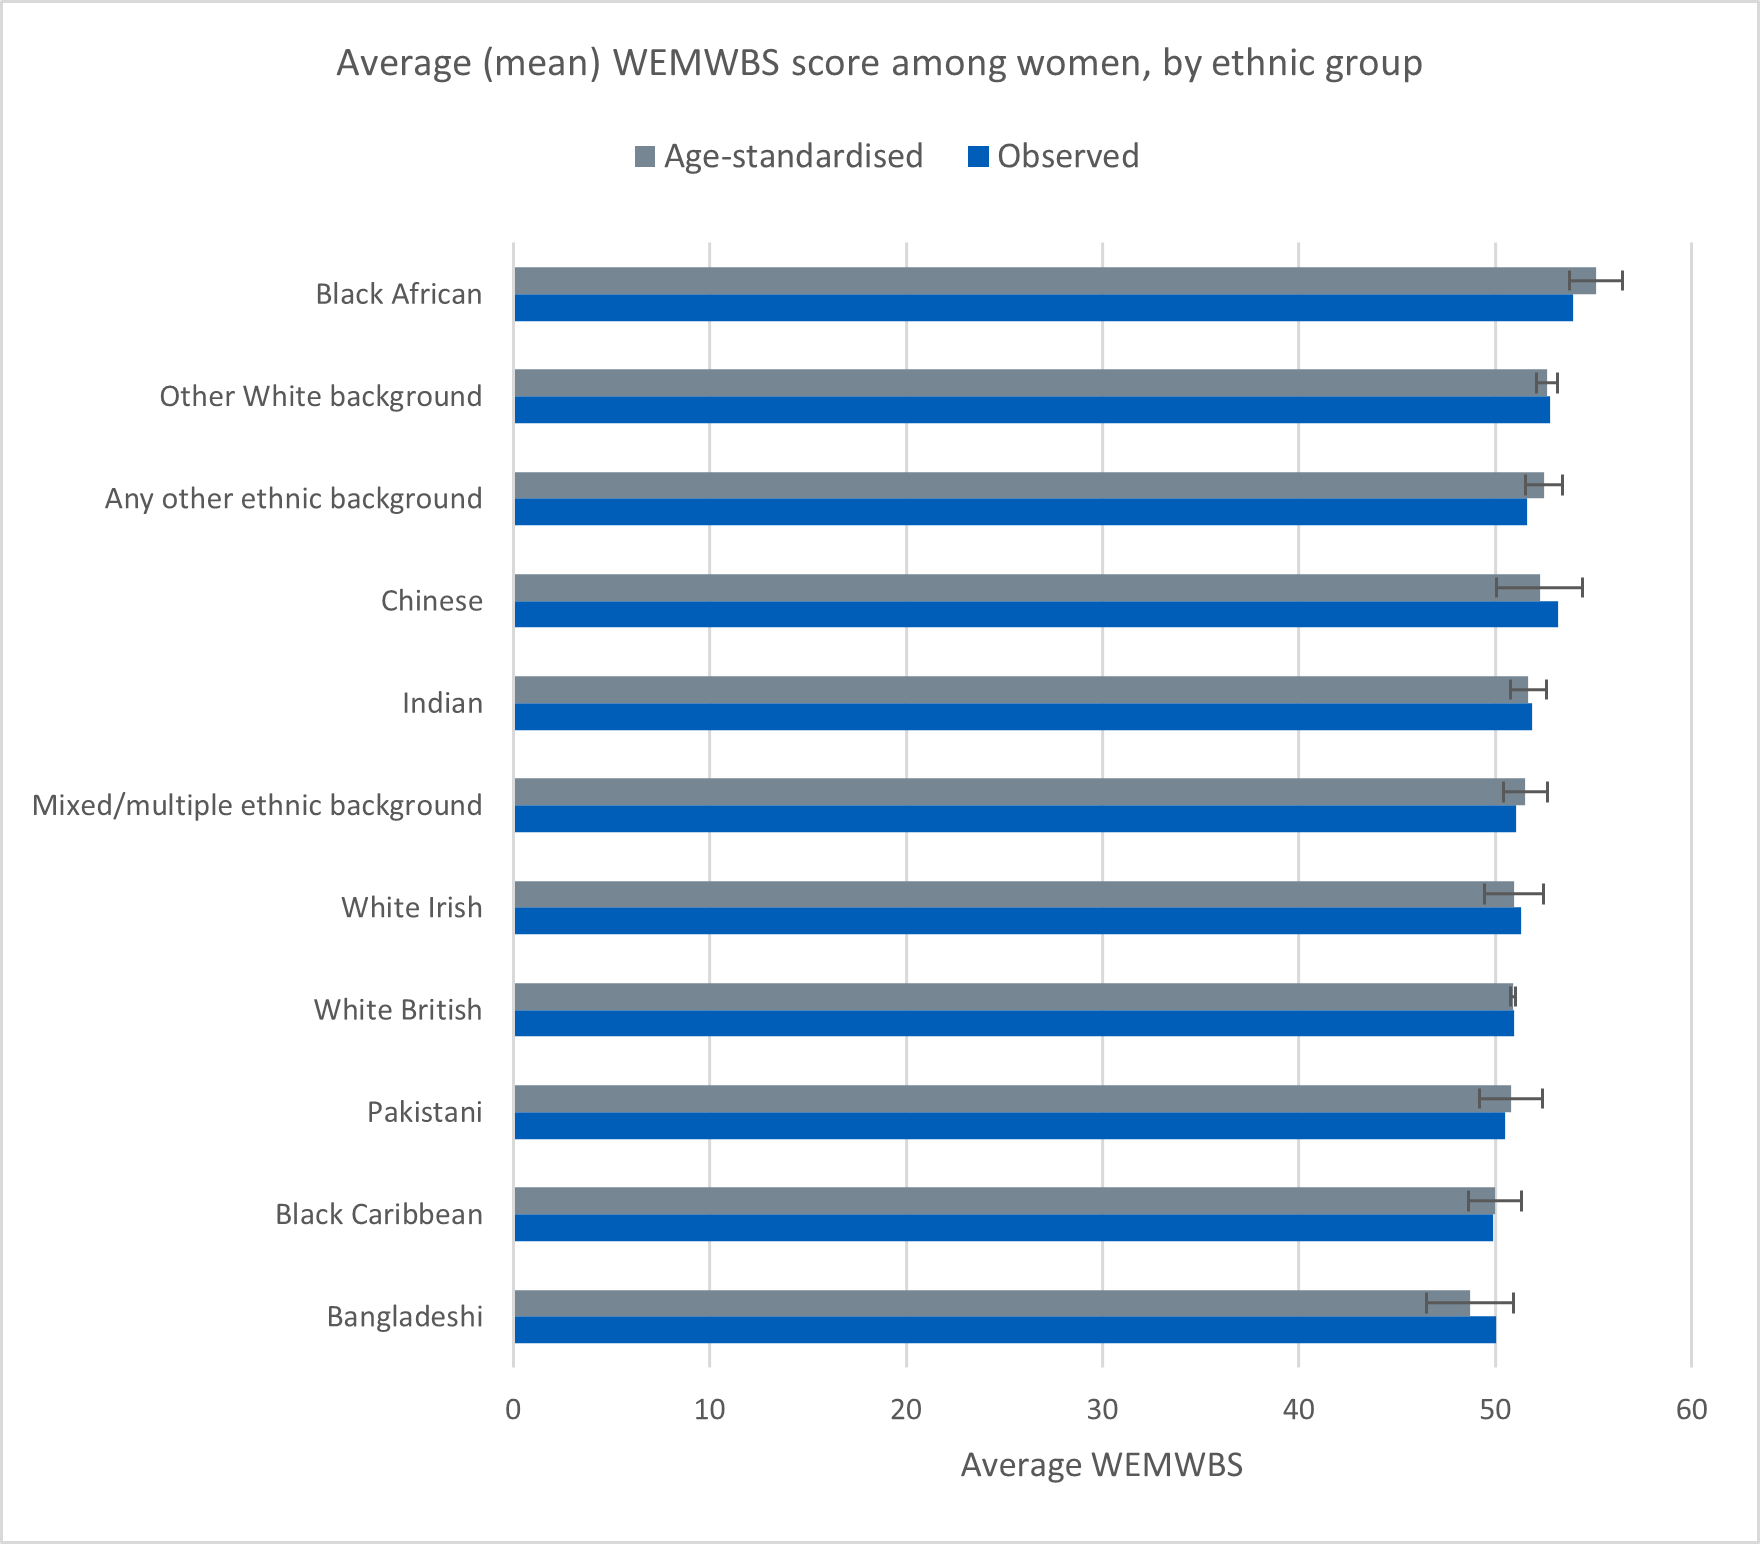
Average (mean) wellbeing scores differed across ethnic groups. Mean scores varied between 51.1 and 55.0 among men and between 49.9 and 54.0 among women.
When age was taken into account, black African men and women had higher scores than those in other groups. Otherwise mean scores were similar.6
Once age had been taken into account, median scores for men were between 52 and 54 for all groups except Chinese men (50), white Irish men (55) and black African men (56). Among women, median scores were between 51 and 53, except for Bangladeshi women (49) and black African women (56).
6 Ethnicity: p<0.001; ethnicity*sex: p=0.106
Last edited: 30 June 2022 9:33 am