Publication, Part of Health Survey England Additional Analyses
Health Survey England Additional Analyses, Ethnicity and Health, 2011-2019 Experimental statistics
Experimental statistics, Official statistics in development
Overweight and obesity
Obesity has long been identified as a major public health problem, both internationally and within the UK. Being overweight or obese is associated with an increased risk of a number of common diseases and causes of premature death, including diabetes, cardiovascular disease and some cancers.
For individuals with excess weight, the risk of poor health increases sharply with increasing body mass index (BMI). There is some evidence that some minority ethnic populations are at greater risk of chronic health conditions related to overweight and obesity than their white equivalents.1
Definitions of body mass index (BMI) and BMI status
BMI is a widely accepted measure of overweight and obesity that takes both height and weight into account. BMI is defined as weight in kilograms divided by height in metres squared (kg/m2). This has been used as a measure of overweight and obesity in the HSE series.
Adults are classified into the following BMI groups according to the World Health Organization (WHO) BMI classification:
- Underweight: less than 18.5 kg/m2
- Normal weight: 18.5 to less than 25 kg/m2
- Overweight: 25 to less than 30 kg/m2
- Obese: 30 kg/m2 or more
A subset of the obese category includes those with a BMI of 40 or more, defined as morbidly obese. These individuals have the highest risk of illness and premature death.2
The WHO definitions refer to adults aged 18 and over. The HSE defines adults as those aged 16 and over, and those aged 16 and 17 are included in this analysis. Elsewhere BMI classifications for young people, including those aged 16 and 17, are dependent on age and sex. For further details, see the HSE 2019 Overweight and obesity in adults and children report.
1 National Institute of Health and Care Excellence. BMI: preventing ill health and premature death and black, Asian and other ethnic minority groups. NICE, London, 2013. https://www.nice.org.uk/guidance/ph46/chapter/1-Recommendations#recommendation-1-preventing-type-2-diabetes
2 Identification and classification of overweight and obesity in National Institute of Health and Care Excellence. Obesity: Identification, assessment and management of overweight and obesity in children, young people and adults. NICE, London, 2014. https://www.nice.org.uk/guidance/cg189/chapter/1-Recommendations#identification-and-classification-of-overweight-and-obesity
How are height, weight and BMI measured?
Participants’ height and weight are measured during the interview. Measures of waist circumference are taken during the nurse interview. For details of the methods and protocols, see the Appendix in the HSE 2019 Overweight and obesity in adults and children report. BMI is calculated as weight in kilograms divided by height in metres squared (kg/m2).
Trends in the prevalence of overweight and obesity in England: 2011 to 2019
Between 2011 and 2019, the prevalence of overweight and obesity among adults showed a slight increase.
- The proportions who were overweight or obese was between 65% and 68% among men and between 57% and 62% among women.
- The proportions of men who were obese varied between 24% and 27% and the proportions of women were generally higher, between 24% and 30%.
The full time series is available in table 3 of overweight and obesity data tables accompanying the HSE 2019 Overweight and obesity in adults and children report.
Overweight and ethnicity
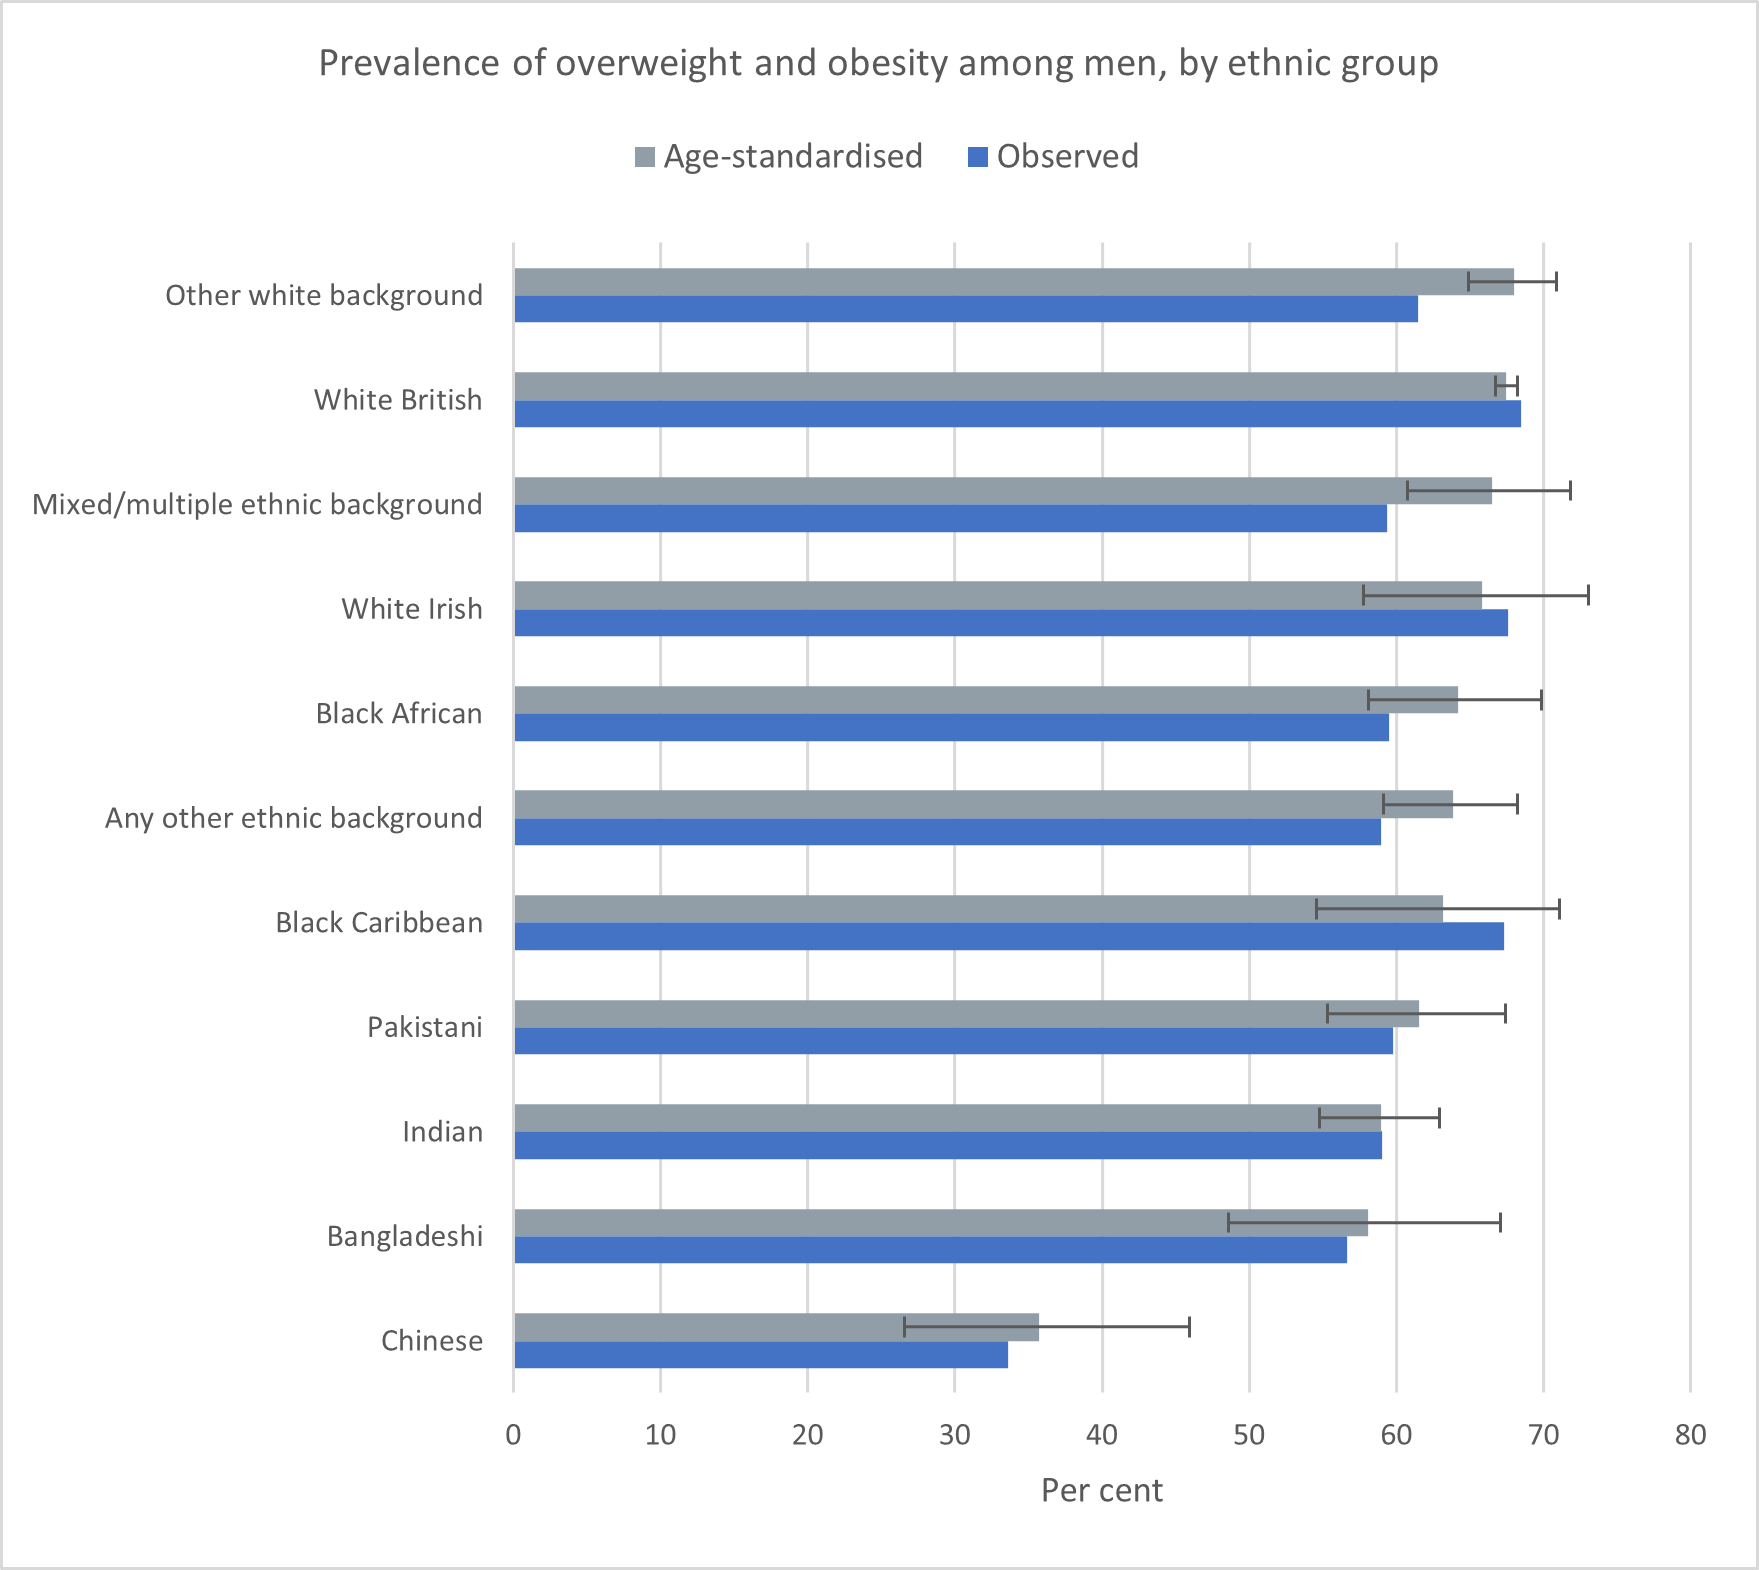
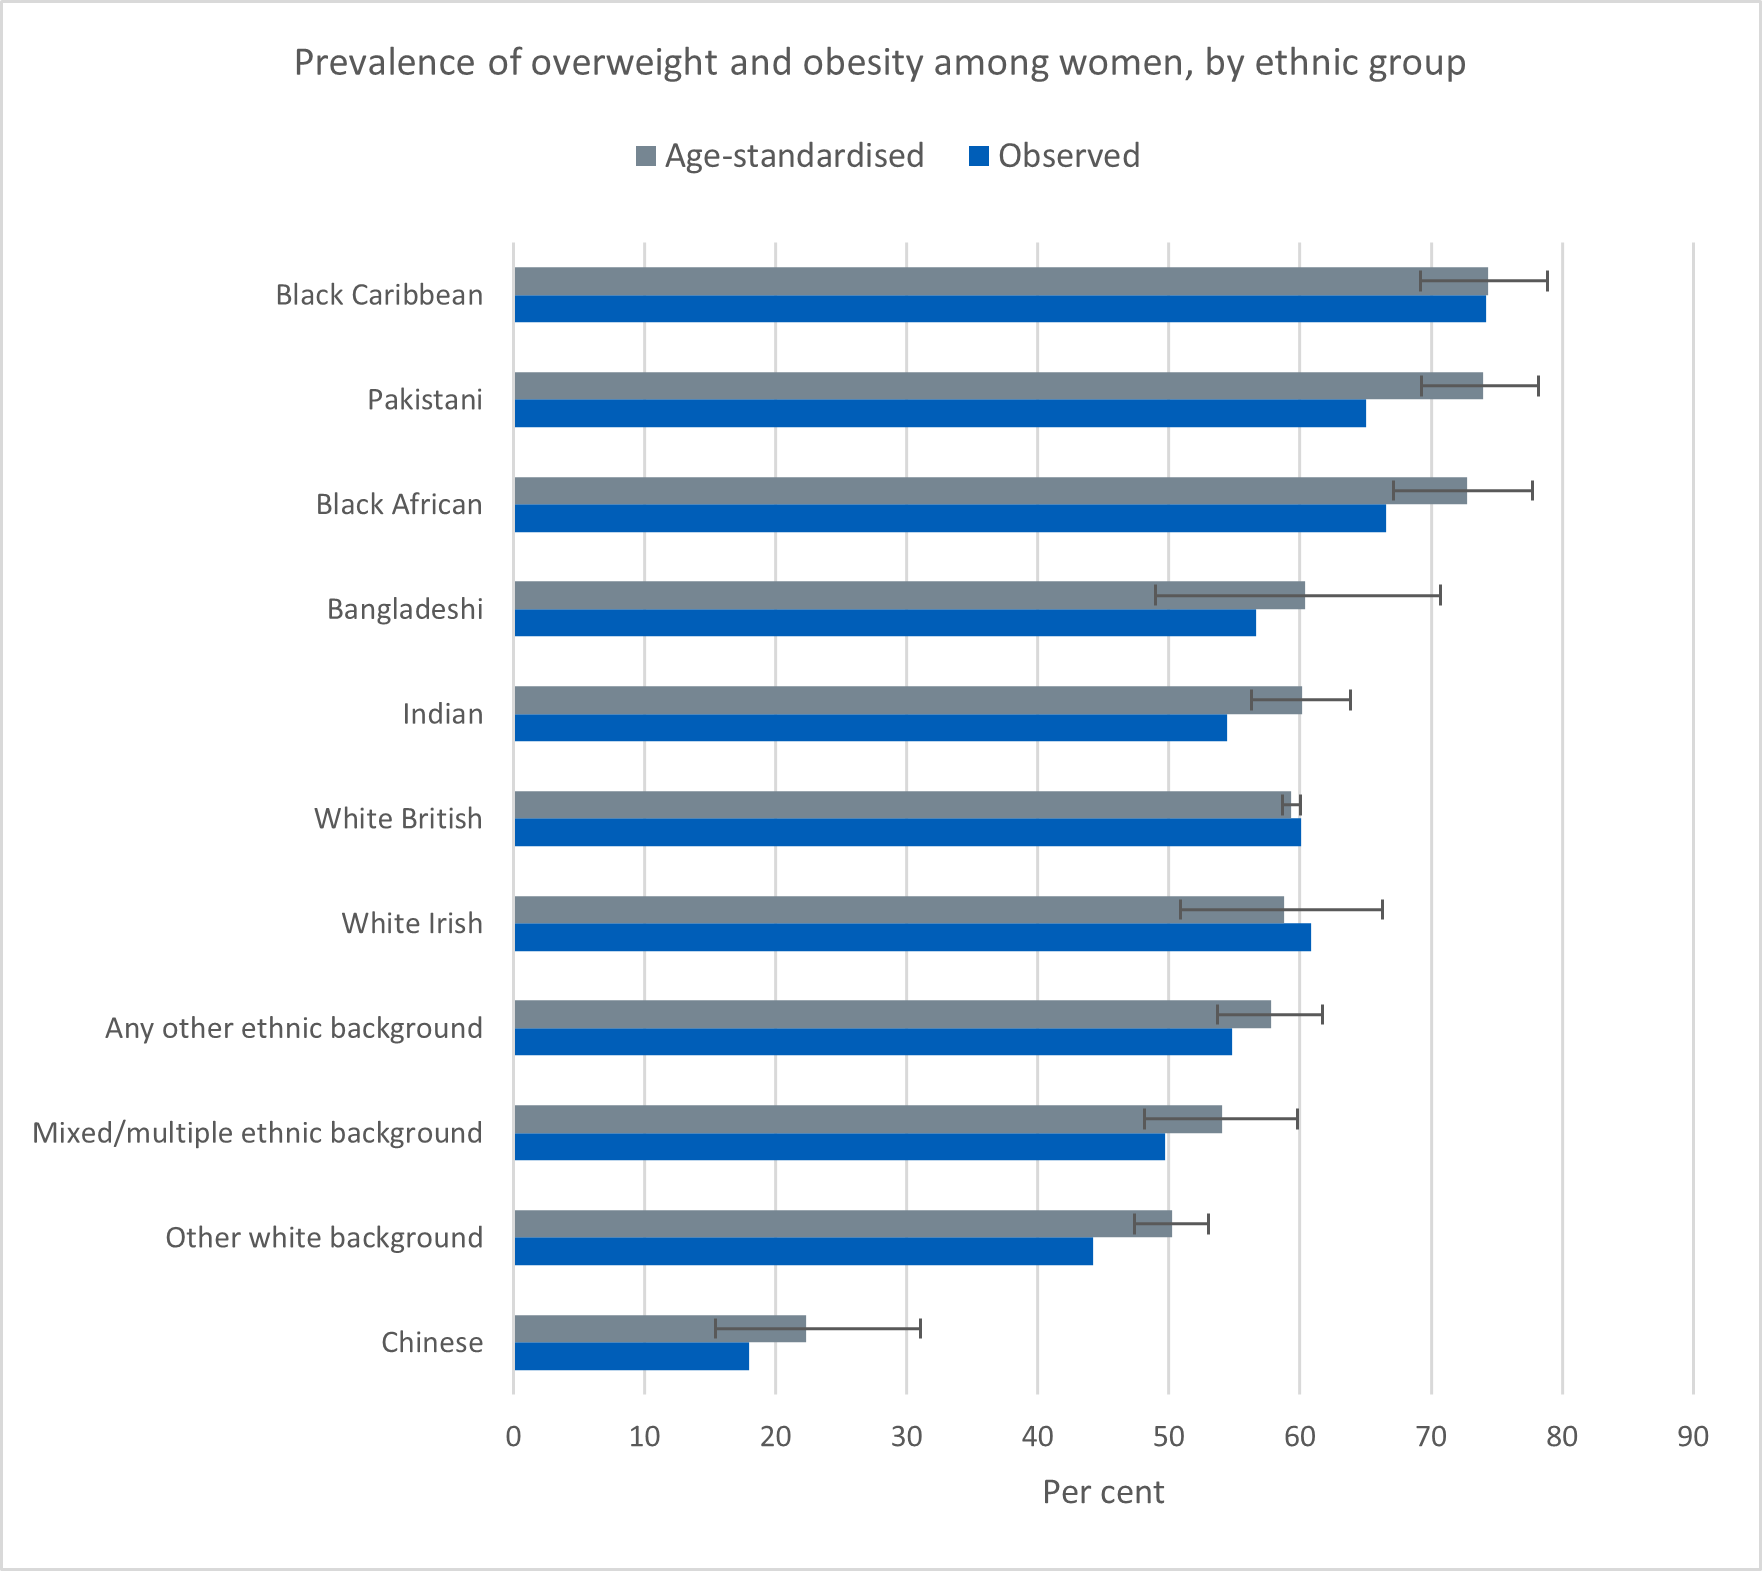
The proportions of adults who were either overweight or obese varied across ethnic groups, with different patterns for men and women.
The proportions were much lower among Chinese adults than those from other ethnic groups: 34% of Chinese men and 18% of Chinese women were either overweight or obese. Among other ethnic groups the proportions varied between 57% and 61% of men and between 44% and 74% of women.
Once age was taken into account, Chinese men and women were less likely than other groups to be overweight or obese.
Otherwise, differences in the proportions of men who were either overweight or obese were not statistically significant across groups.
Among women, prevalence was lowest among those from other white and Mixed and multiple backgrounds and highest among those from black Caribbean, Pakistani and black African backgrounds.3
3 Ethnicity: p<0.001; sex: p<0.001; ethnicity*sex: p<0.001
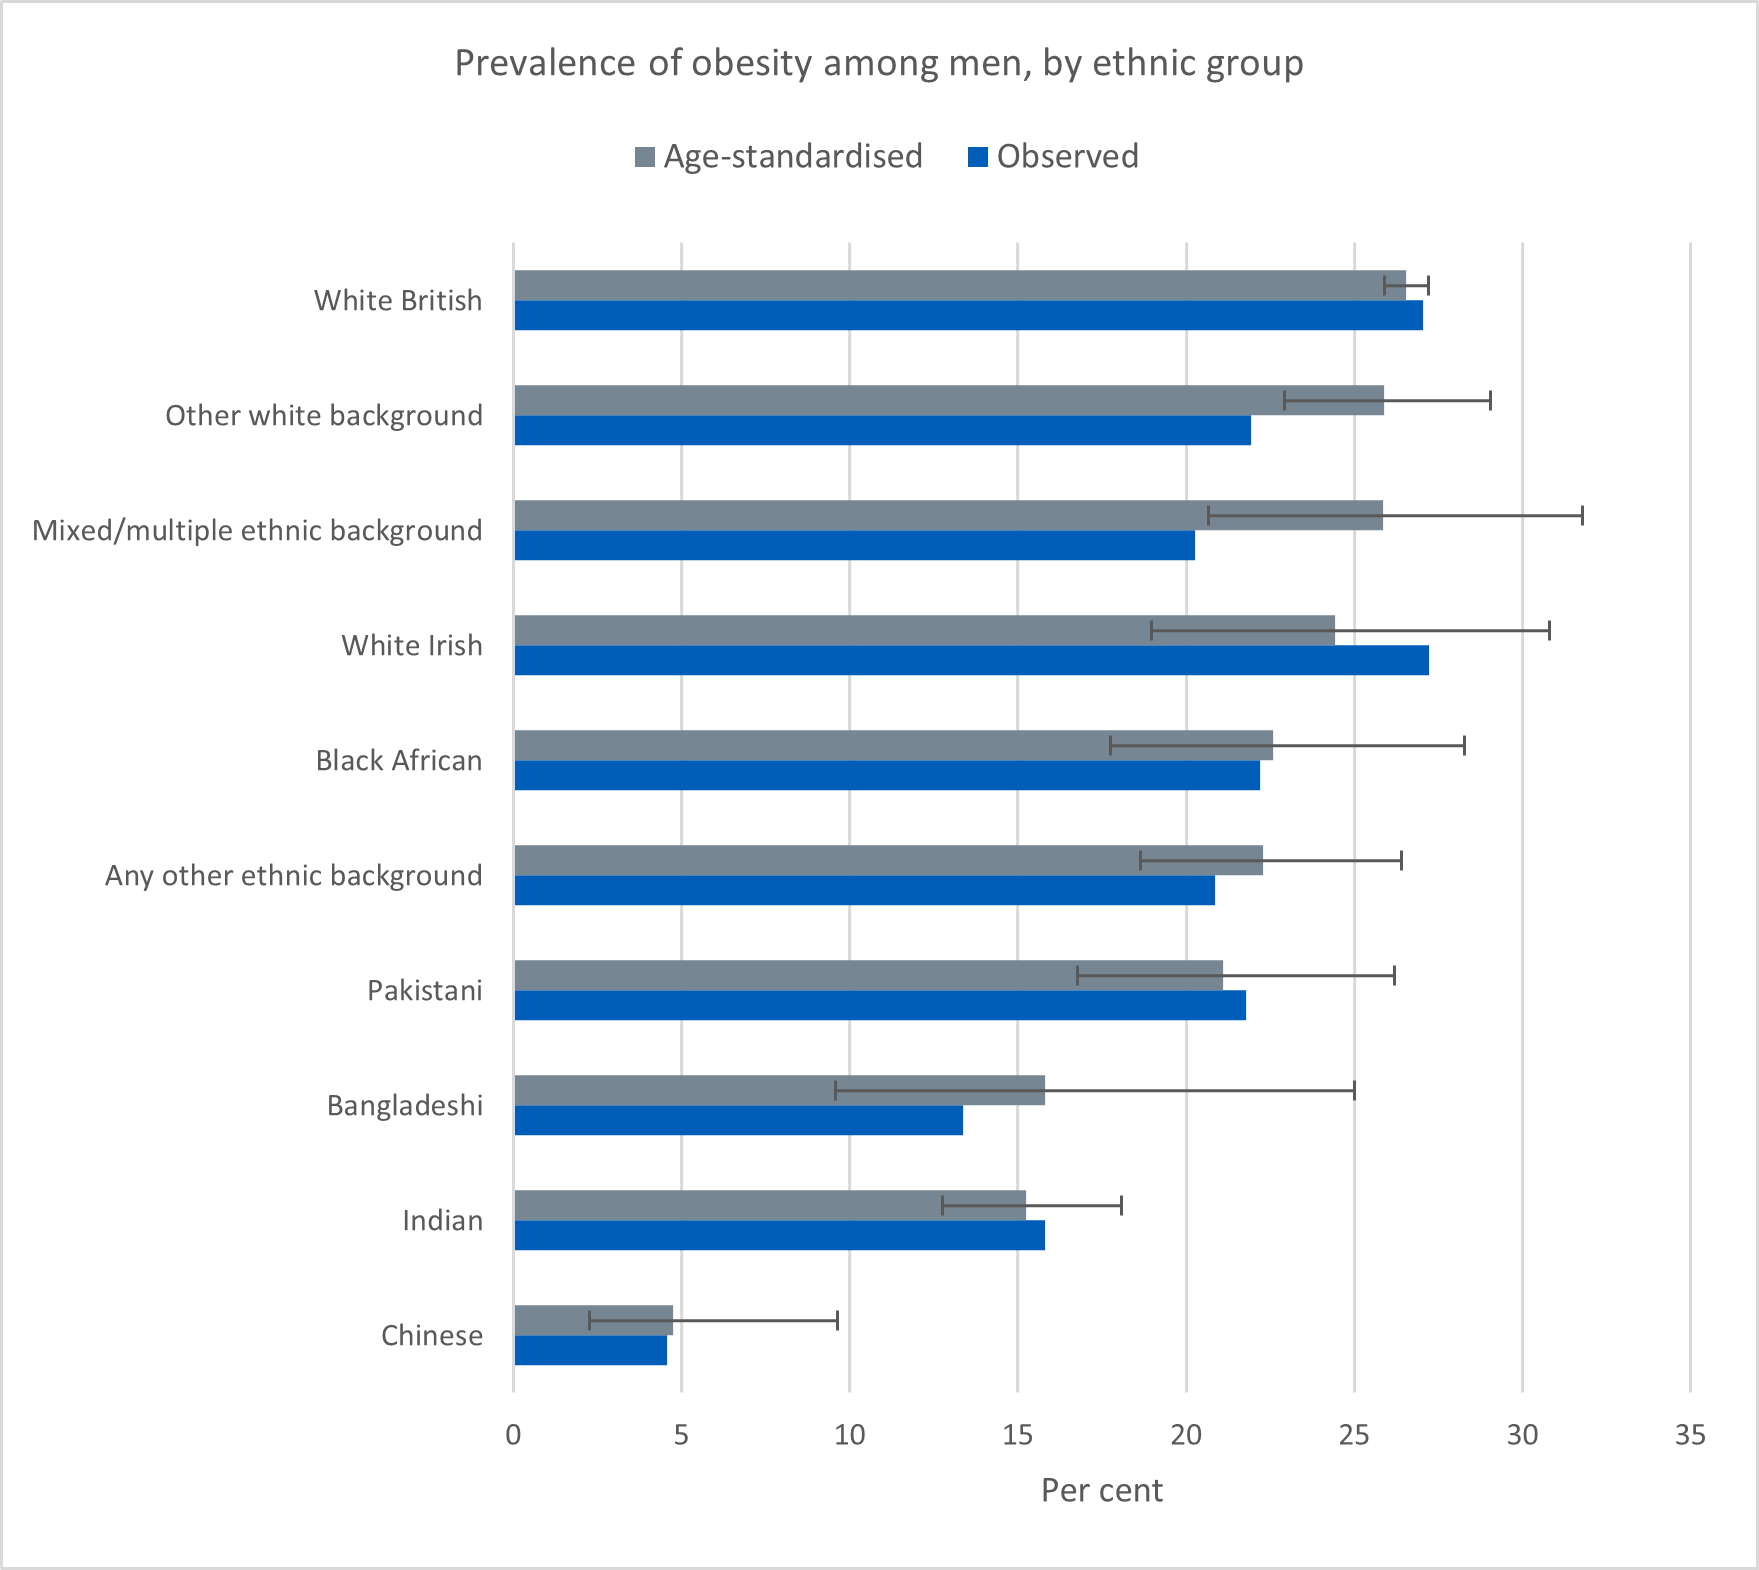
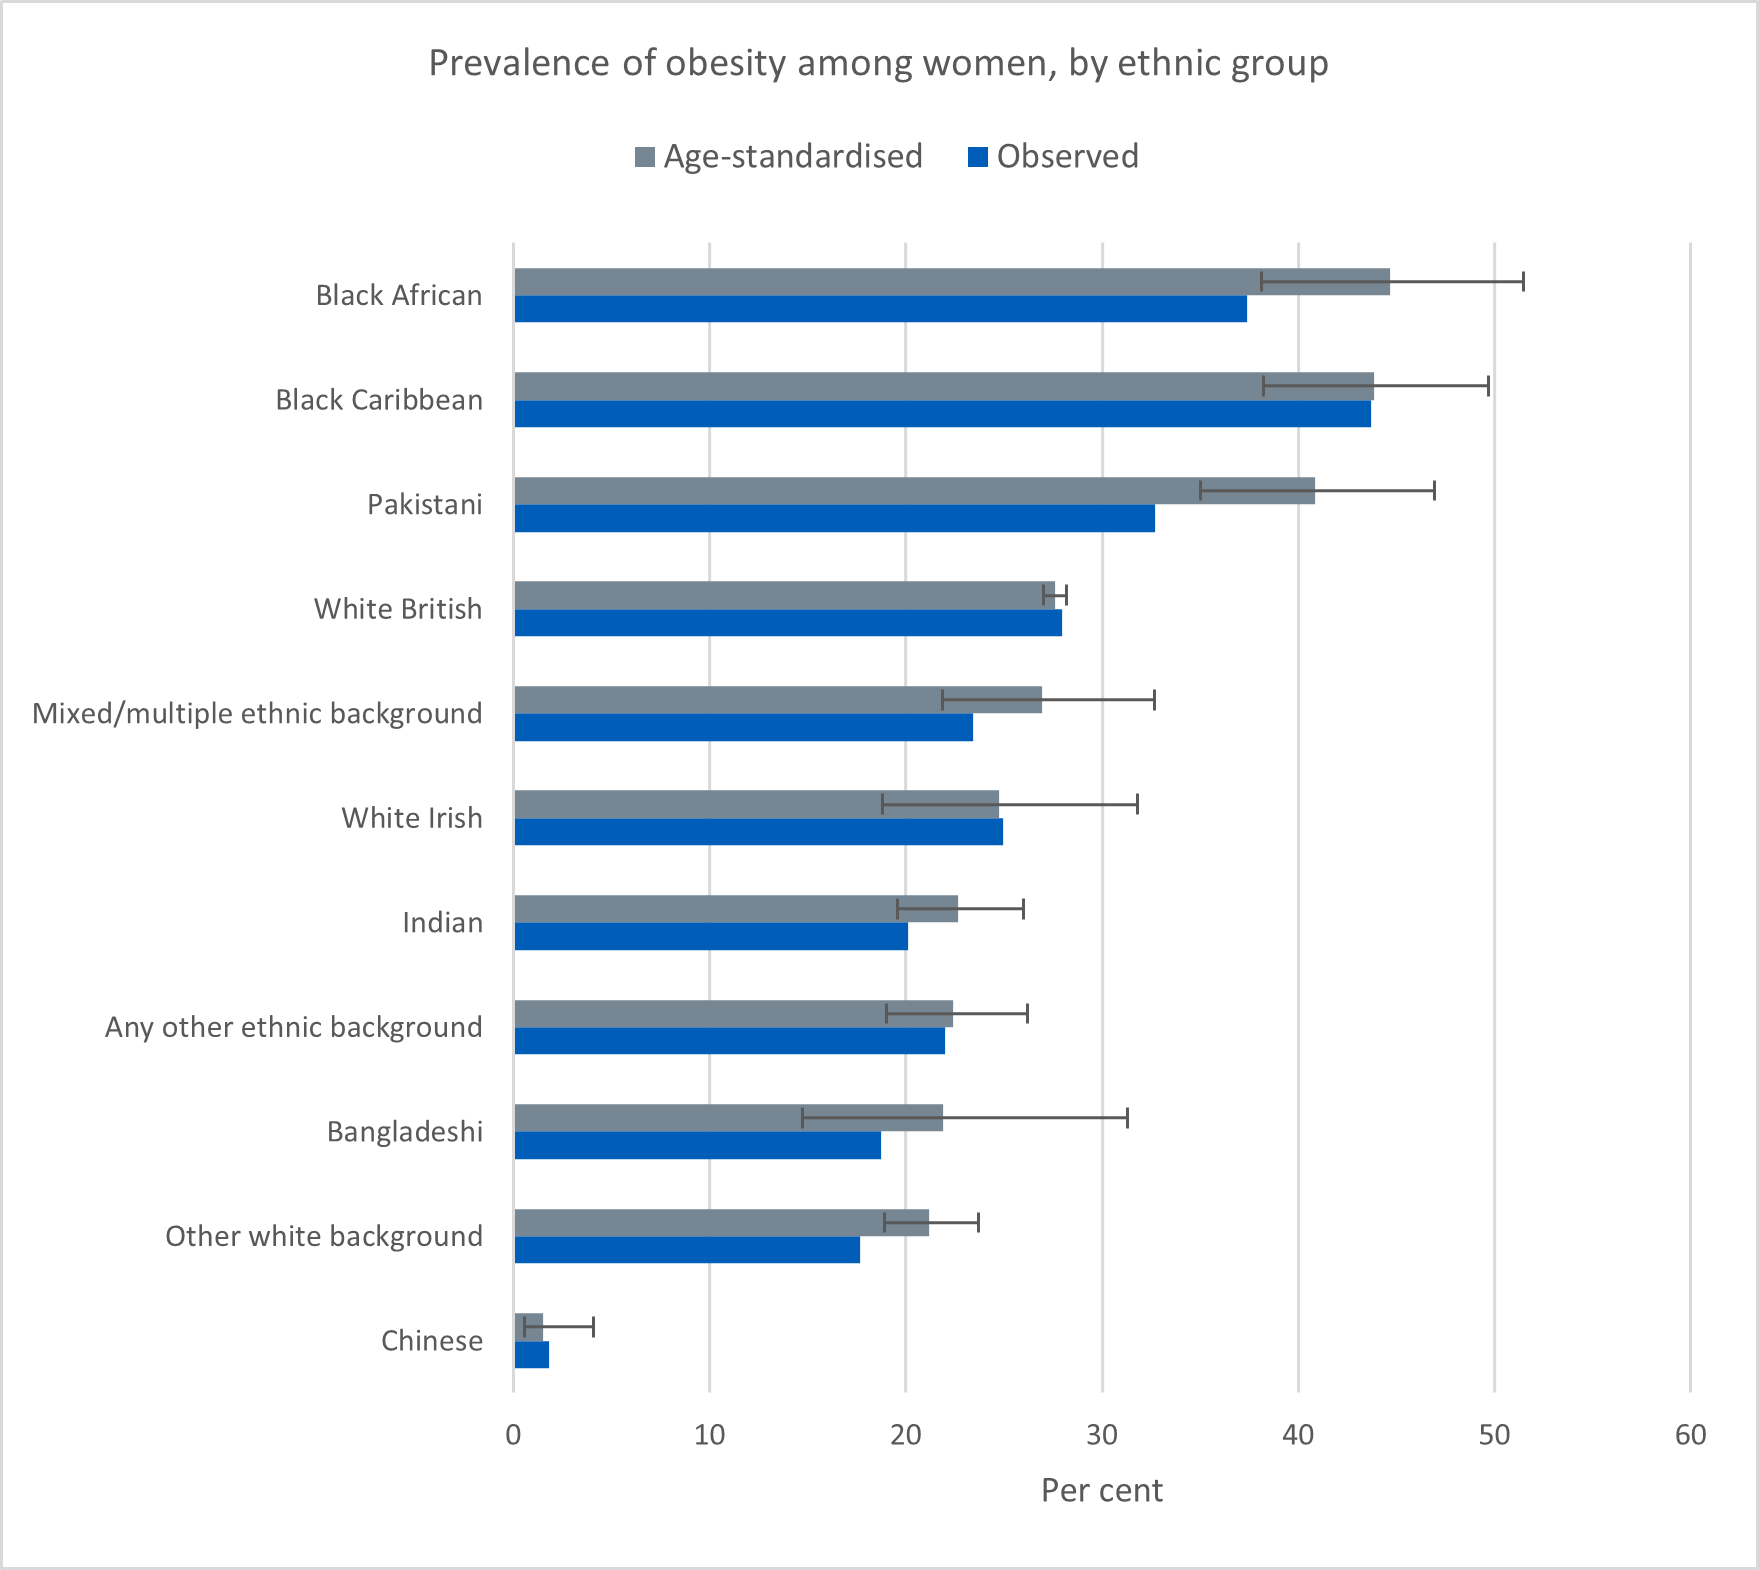
Obesity and ethnicity
Chinese adults were also less likely to be obese than those in other groups: 5% of Chinese men and 2% of Chinese women were obese. Among other groups, the proportions who were obese varied between 13% and 31% of men and 18% and 44% of women.
Once age was taken into account, Chinese men and women were least likely to be obese.
Among other groups the proportions of men who were obese did not vary significantly.
Among women, Black African, Black Caribbean and Pakistani women were more likely than other groups to be obese.4
4 Ethnicity: p<0.001; sex: p<0.001; ethnicity*sex: p<0.001
Definition of very high waist circumference
BMI does not distinguish between mass due to body fat and mass due to muscular physique. It also does not take account of the distribution of fat. An alternative measure of obesity, abdominal obesity, is defined using waist circumference and categorised into desirable, high and very high by sex-specific thresholds.
- Men: waist circumference of less than 94cm is low, 94cm to 102cm is high and more than 102cm is very high
- Women: less than 80cm is low, 80cm to 88cm is high and more than 88cm is very high
NICE guidance specifies that waist circumference should be considered as a second measurement, after BMI. The NICE guidance uses a combination of BMI, waist circumference and the existence of co-morbidities to recommend the level of medical intervention that may be needed.
How is waist circumference measured?
Measures of waist circumference are taken during the nurse interview.
For details of the methods and protocols, see the Appendix in the HSE 2019 Overweight and obesity in adults and children report.
Trends in the prevalence of very high waist circumference in England: 2011 to 2019
Between 2011 and 2019, women were more likely than men to have a very high waist circumference. The proportions of men in this category varied between 32% and 36% and the proportions of women varied between 44% and 48%, with no clear trend.
The full time series is available in table 7 of overweight and obesity data tables accompanying the HSE 2019 Overweight and obesity in adults and children report.
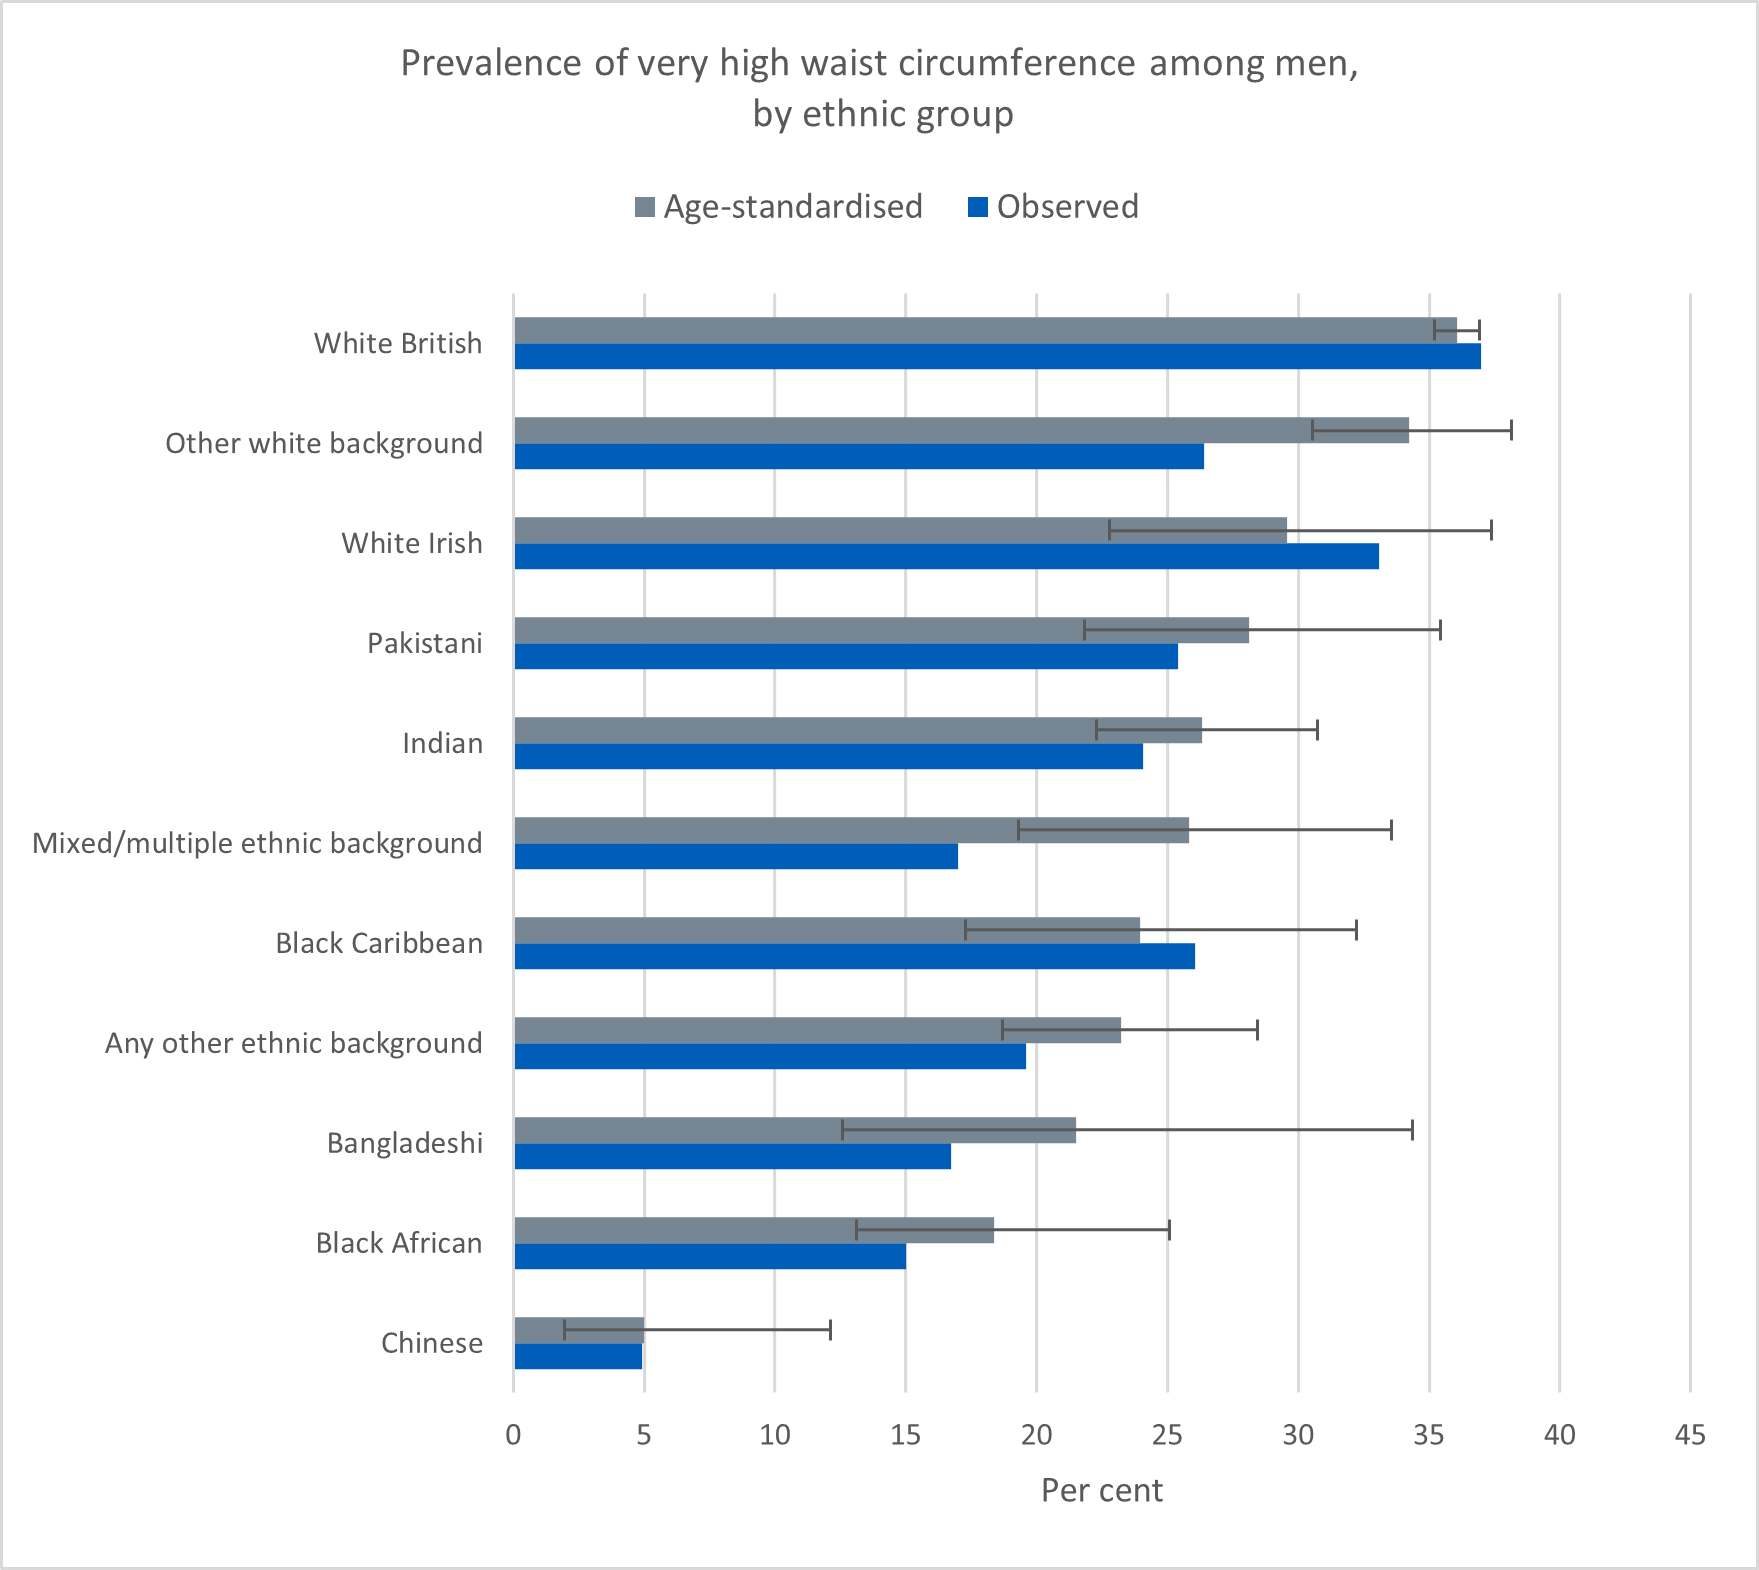
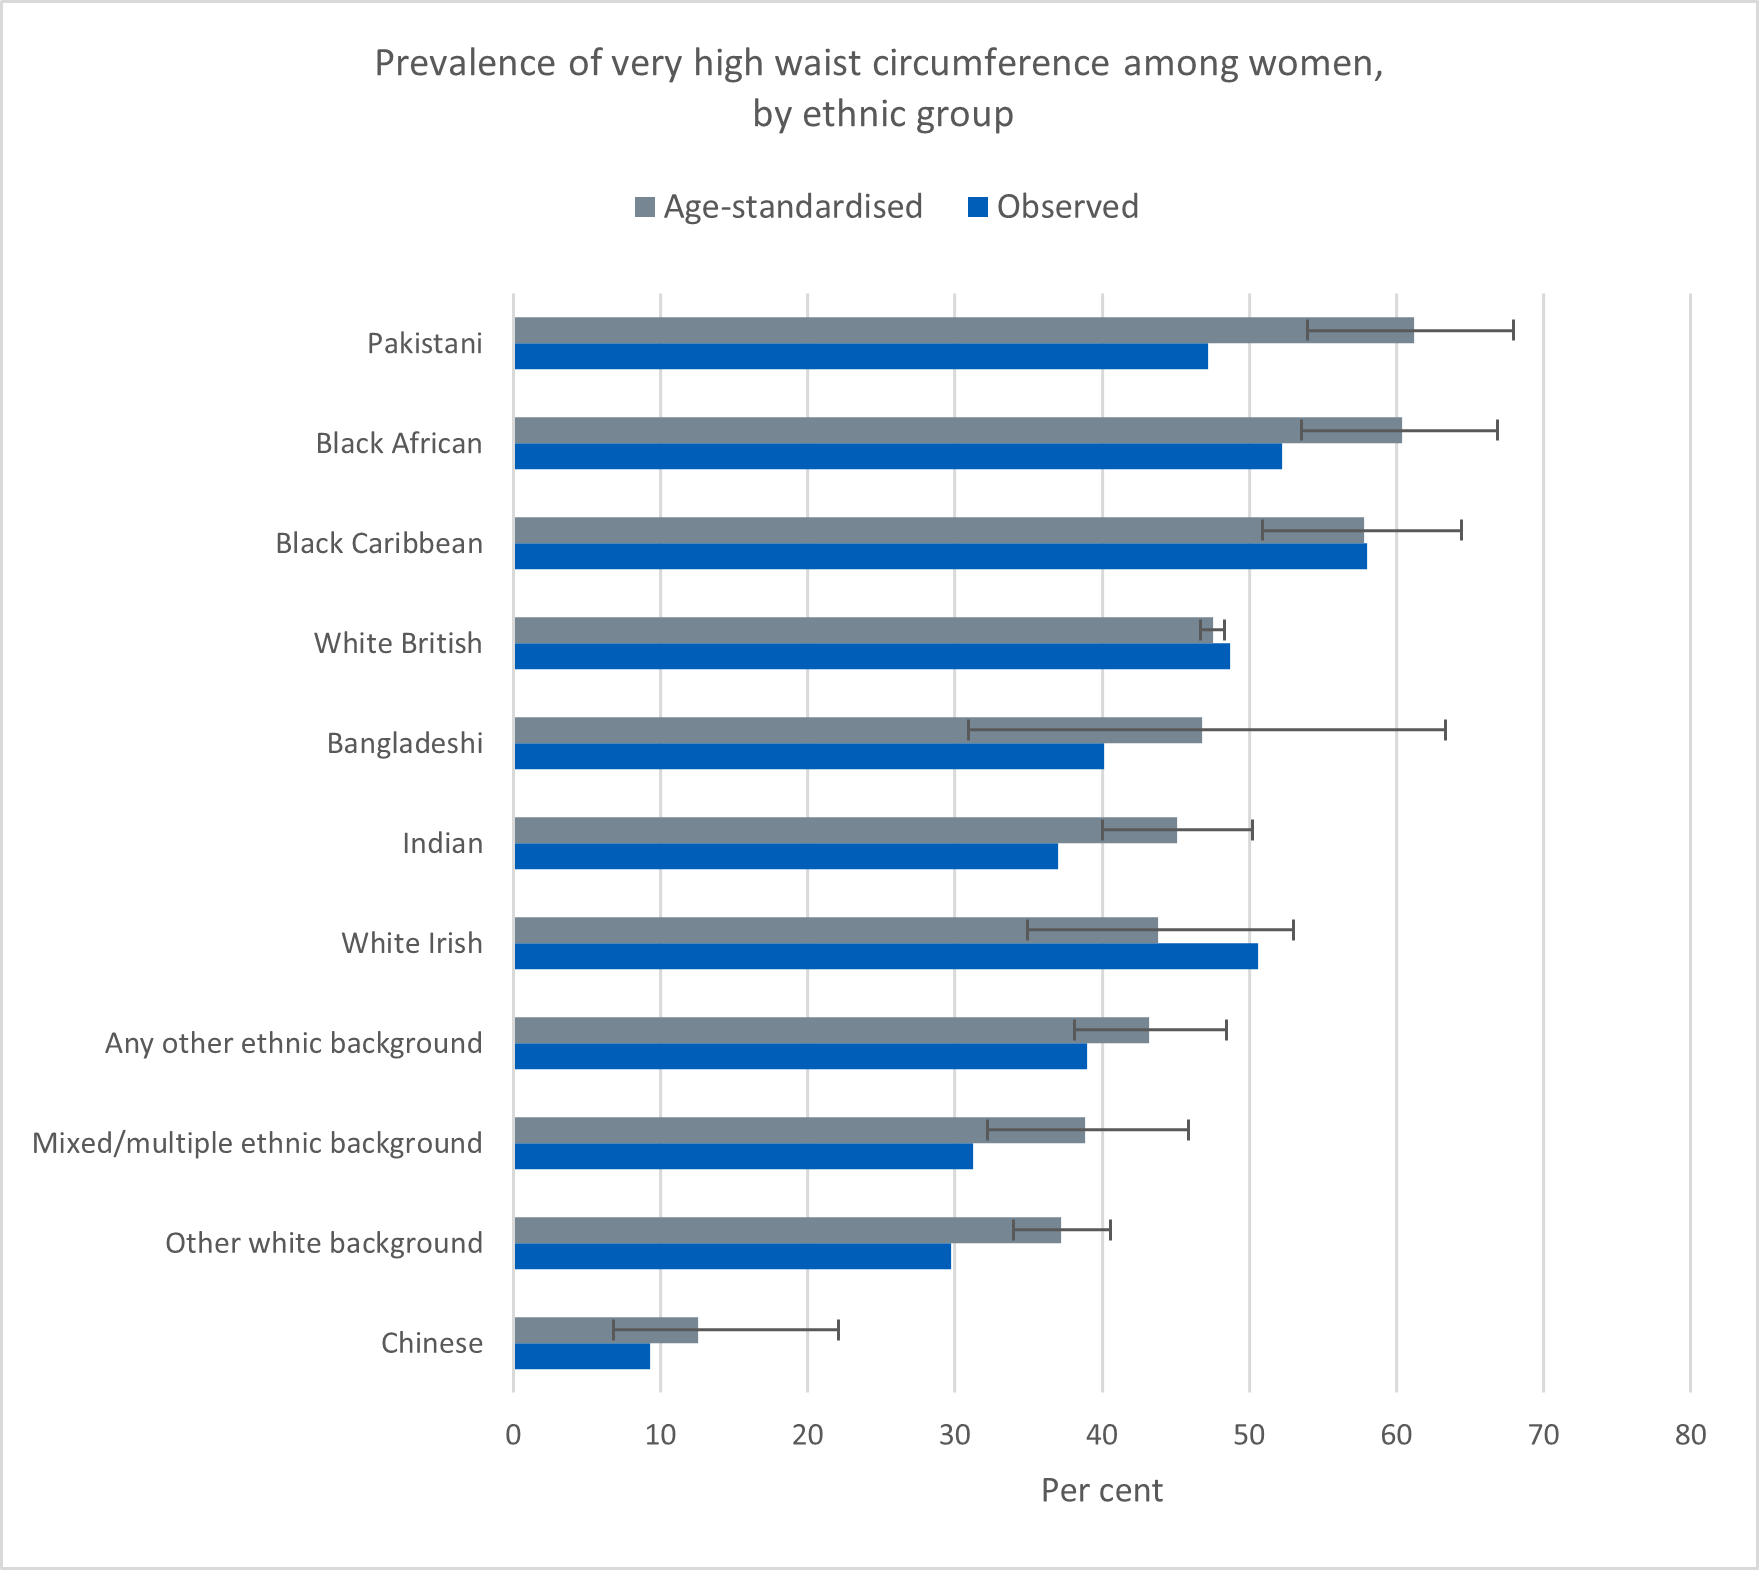
Very high waist circumference and ethnicity
The proportion of adults with a very high waist circumference varied across ethnic groups and between men and women. This was relatively uncommon among Chinese men (5%) and women (9%). Among other ethnic groups the proportions with a very high waist circumference varied between 15% and 37% of men and between 30% and 58% of women.
Once age was taken into account, Chinese men and women were least likely to have a very high waist circumference.
Otherwise, among men, the proportions with a very high waist circumference were similar across groups.
Among women, those from Pakistani, black African and black Caribbean backgrounds were most likely to have a very high waist circumference.5
5 Ethnicity: p<0.001; sex: p<0.001; ethnicity*sex: p<0.001
Obesity and diabetes risk
A WHO review in 2004 found that for Asian adults (including South Asian and Chinese) diabetes risk is increased at a lower threshold than for white adults. This review did not identify the risk for black adults, although NICE recommends extending use of these thresholds for black African and African-Caribbean populations.
See NICE BMI: preventing ill health and premature death and black, Asian and other ethnic minority groups Recommendation 1 preventing type 2 diabetes
Definitions of diabetes risk
The thresholds of risk for black and Asian populations are as follows:
- Increasing but acceptable risk: Asian and black populations - BMI 18.5 kg/m2 to less than 23 kg/m2
- Increased risk: Asian and black populations – BMI 23 kg/m2 to less than 27.5 kg/m2
- High risk: Asian and black populations – BMI 27.5 kg/m2 or higher
The thresholds for white ethnic groups are included; these are equivalent to the standard adult thresholds for normal weight, overweight and obese.
- Increasing but acceptable risk: white populations - BMI 18.5 kg/m2 to less than 25 kg/m2
- Increased risk: white populations – BMI 23 kg/m2 to less than 30 kg/m2
- High risk: white populations – BMI 30 kg/m2 or higher
Similar thresholds for diabetes risk have not been determined for mixed and other groups, and these participants are not included in this analysis.
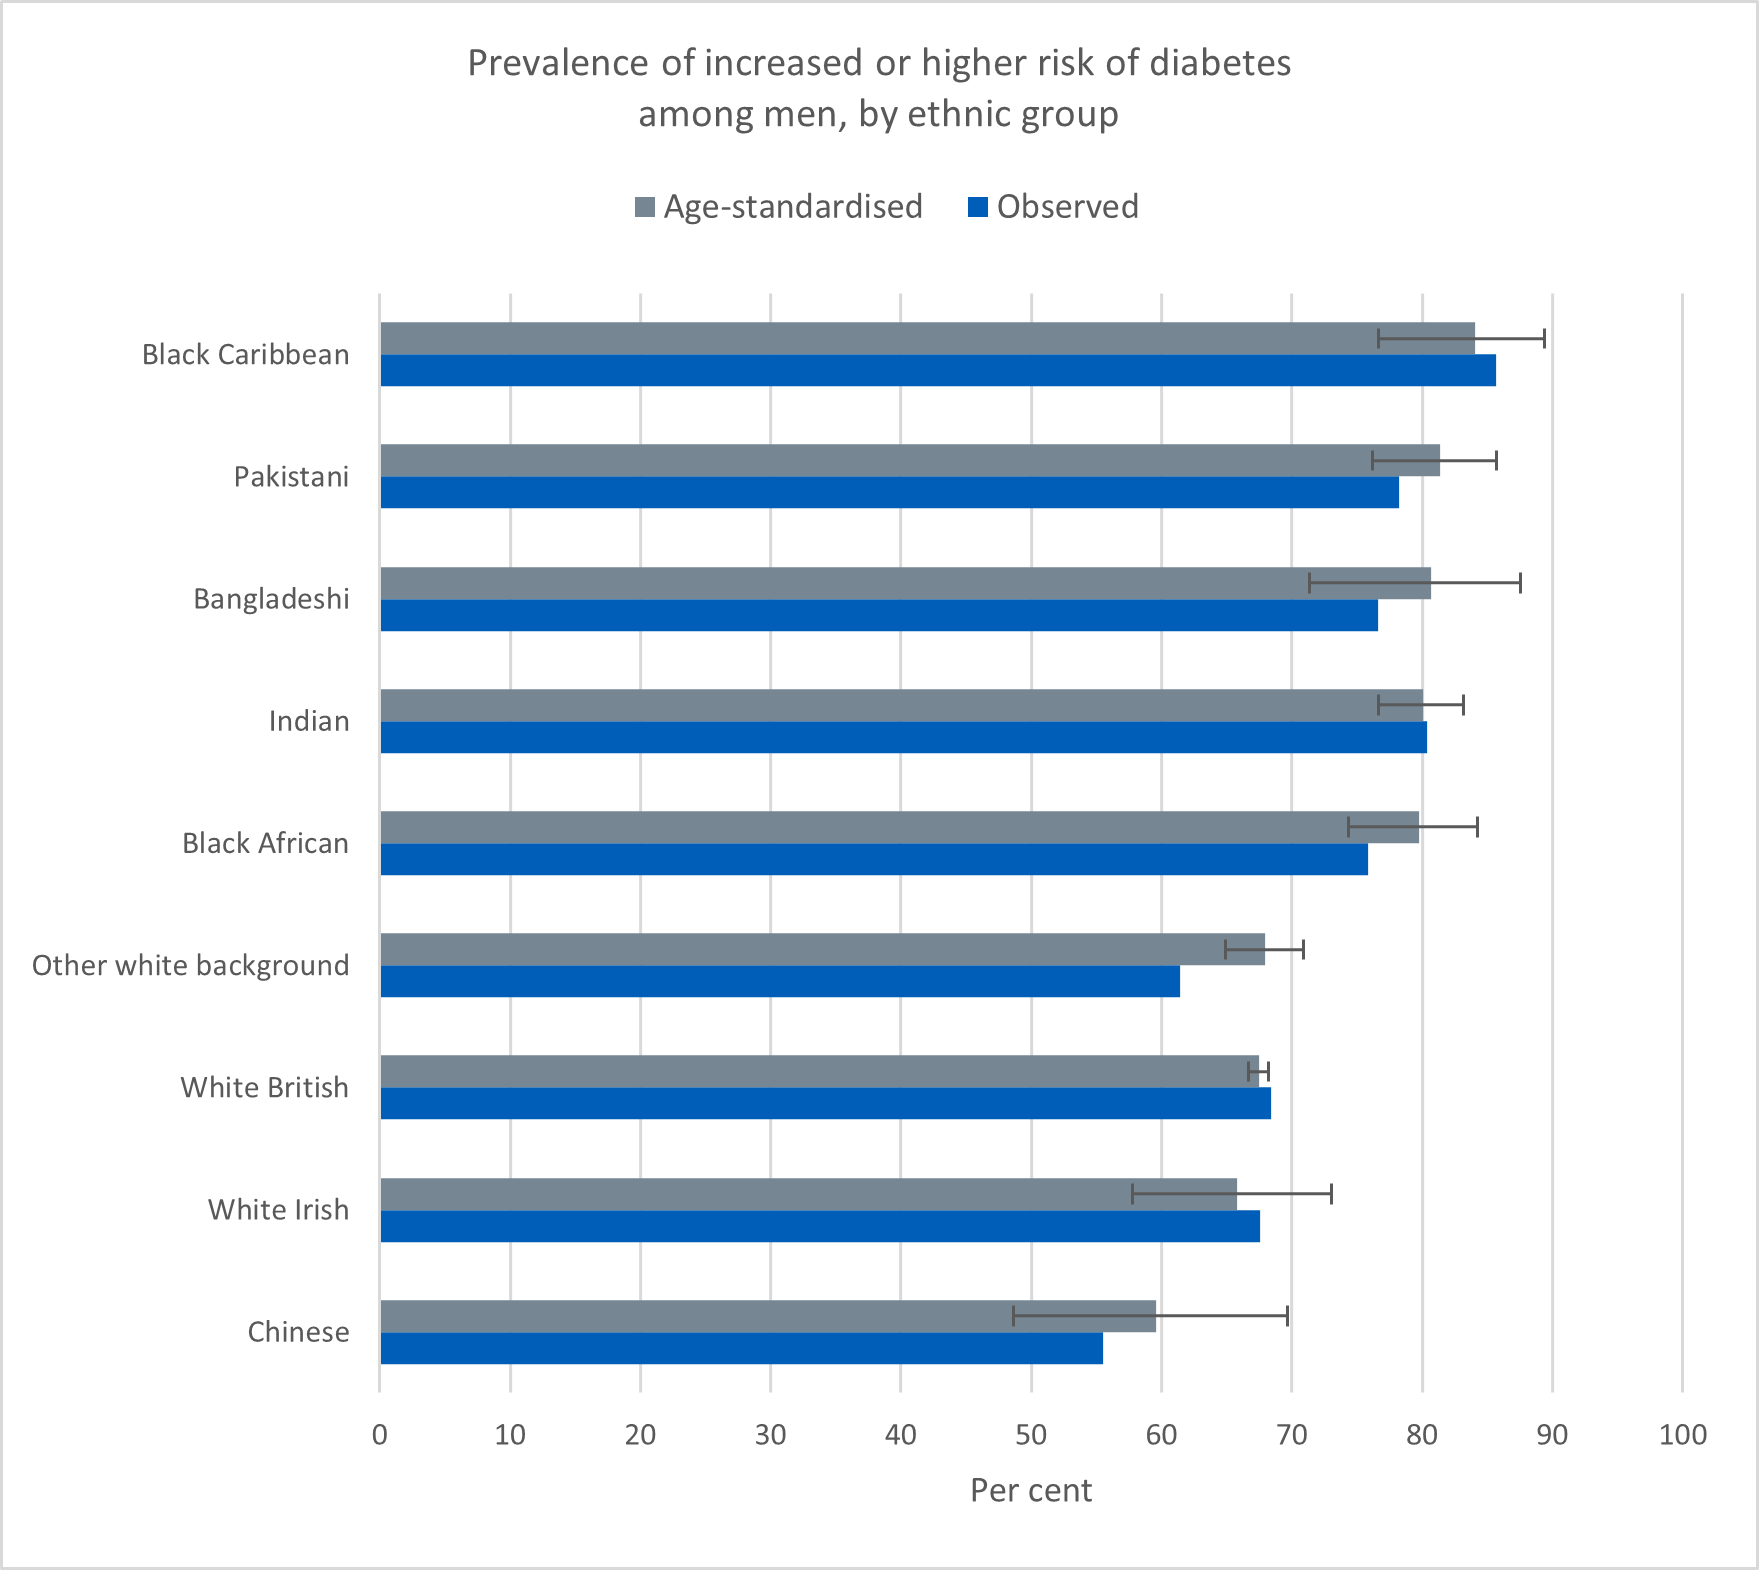
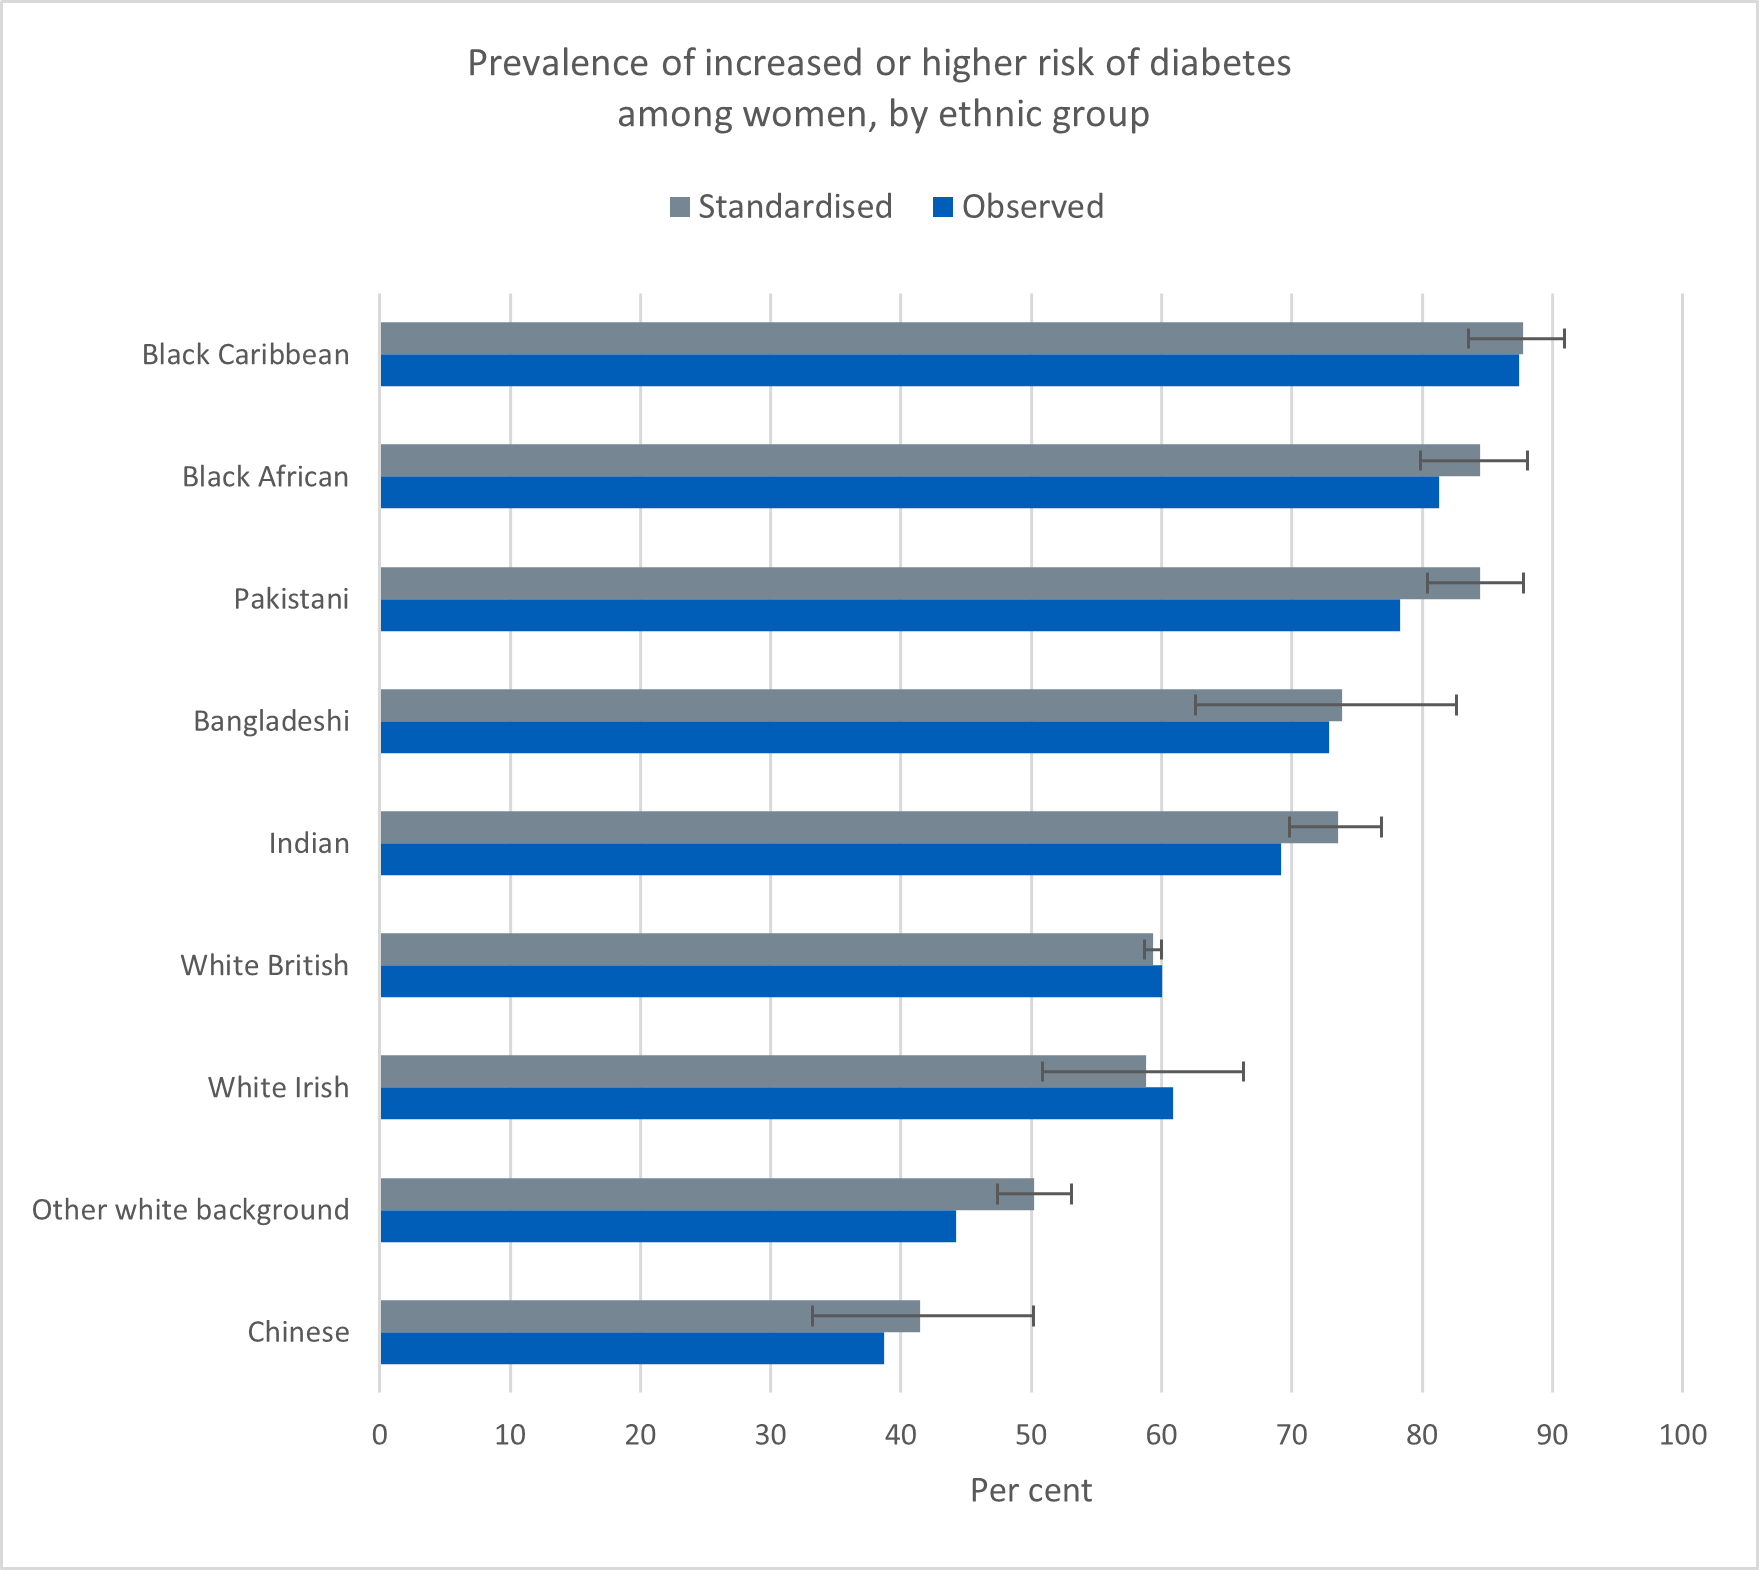
Diabetes risk and ethnicity
The proportions of Chinese men and women at risk – 56% and 39% respectively – were relatively low. Among other adults, the proportions at increased or high risk of diabetes was between 61% and 86% of men and between 44% and 87% of women.
When age was taken into account, broadly similar patterns of risk were seen among men and women. Chinese and white men and women were less likely to be at increased or high risk of diabetes than were those from black and other Asian backgrounds.6
6 Ethnicity: p<0.001; ethnicity*sex: p<0.001
Last edited: 30 June 2022 9:33 am