Publication, Part of Health Survey England Additional Analyses
Health Survey England Additional Analyses, Ethnicity and Health, 2011-2019 Experimental statistics
Experimental statistics, Official statistics in development
The sample
Ethnicity Classification
Participants within the HSE define their own ethnicity based on the 2011 ONS Census categories.
Any single year will include relatively small samples from each minority ethnic group. To ensure sufficient bases for the analysis, data have been combined from nine survey years. Some groups with relatively small numbers within the sample have been combined into two larger categories. These are the eleven groups used for analysis within this report.
- White British
- White Irish
- Other white backgrounds (including Gypsy or Irish Traveller)
- Mixed and multiple backgrounds (including white and black Caribbean, white and black African, white and Asian, and any other mixed or multiple backgrounds)
- Indian
- Pakistani
- Bangladeshi
- Chinese
- Black African
- Black Caribbean
- Other backgrounds (including any other Asian background, any other black background, Arab, and any other ethnic group).
Sample size
The combined sample for whom there is ethnicity information available between 2011 and 2019 is 73,947 men and women. 99.7% of adult participants had answered the question about their ethnicity. The majority (82%) classified themselves as white British. Table A shows the numbers of men and women in each ethnic group used in the analysis.
|
|---|
The HSE sample is subject to what is called attrition, that is not everyone completed all stages of the interview. Base sizes for some tables will, therefore, be smaller than those shown. In all cases tables show the numbers of valid responses within each group.
Profile of the sample
Ethnic groups vary in their socio-economic and demographic composition.1
Individuals’ health and related behaviours vary with their circumstances and across their life course. These variations may contribute to the differences between ethnic groups in the health aspects covered by this report.
Age, household income and the characteristics of the areas in which people live have all been shown to be associated with differences in the prevalence of the health conditions and health-related behaviours. These characteristics are not evenly distributed across ethnic groups, and are likely to underlie the differences between groups described in this report.
1 For more information, see the Ethnicity Facts and figures website https://www.ethnicity-facts-figures.service.gov.uk/
Age
The age profile of the different ethnic groups varies considerably and this has important implication for the interpretation of findings about health and health-related behaviours. This is illustrated by examples from the general population taken from the 2019 Health Survey for England.
- The prevalence of hypertension (high blood pressure) increased with age from 5% of under 25s to 54% of those aged 65 and over.
- The proportion of adults who were overweight or obese increased with age from 37% of adults aged 16 to 24 to 73% of adults aged 45 to 54 and was above 70% in all ages above 45 years.
- Cigarette smoking was most common among adults aged between 25 and 34 (25%), and decreased with age thereafter to 6% of adults aged 75 and over.
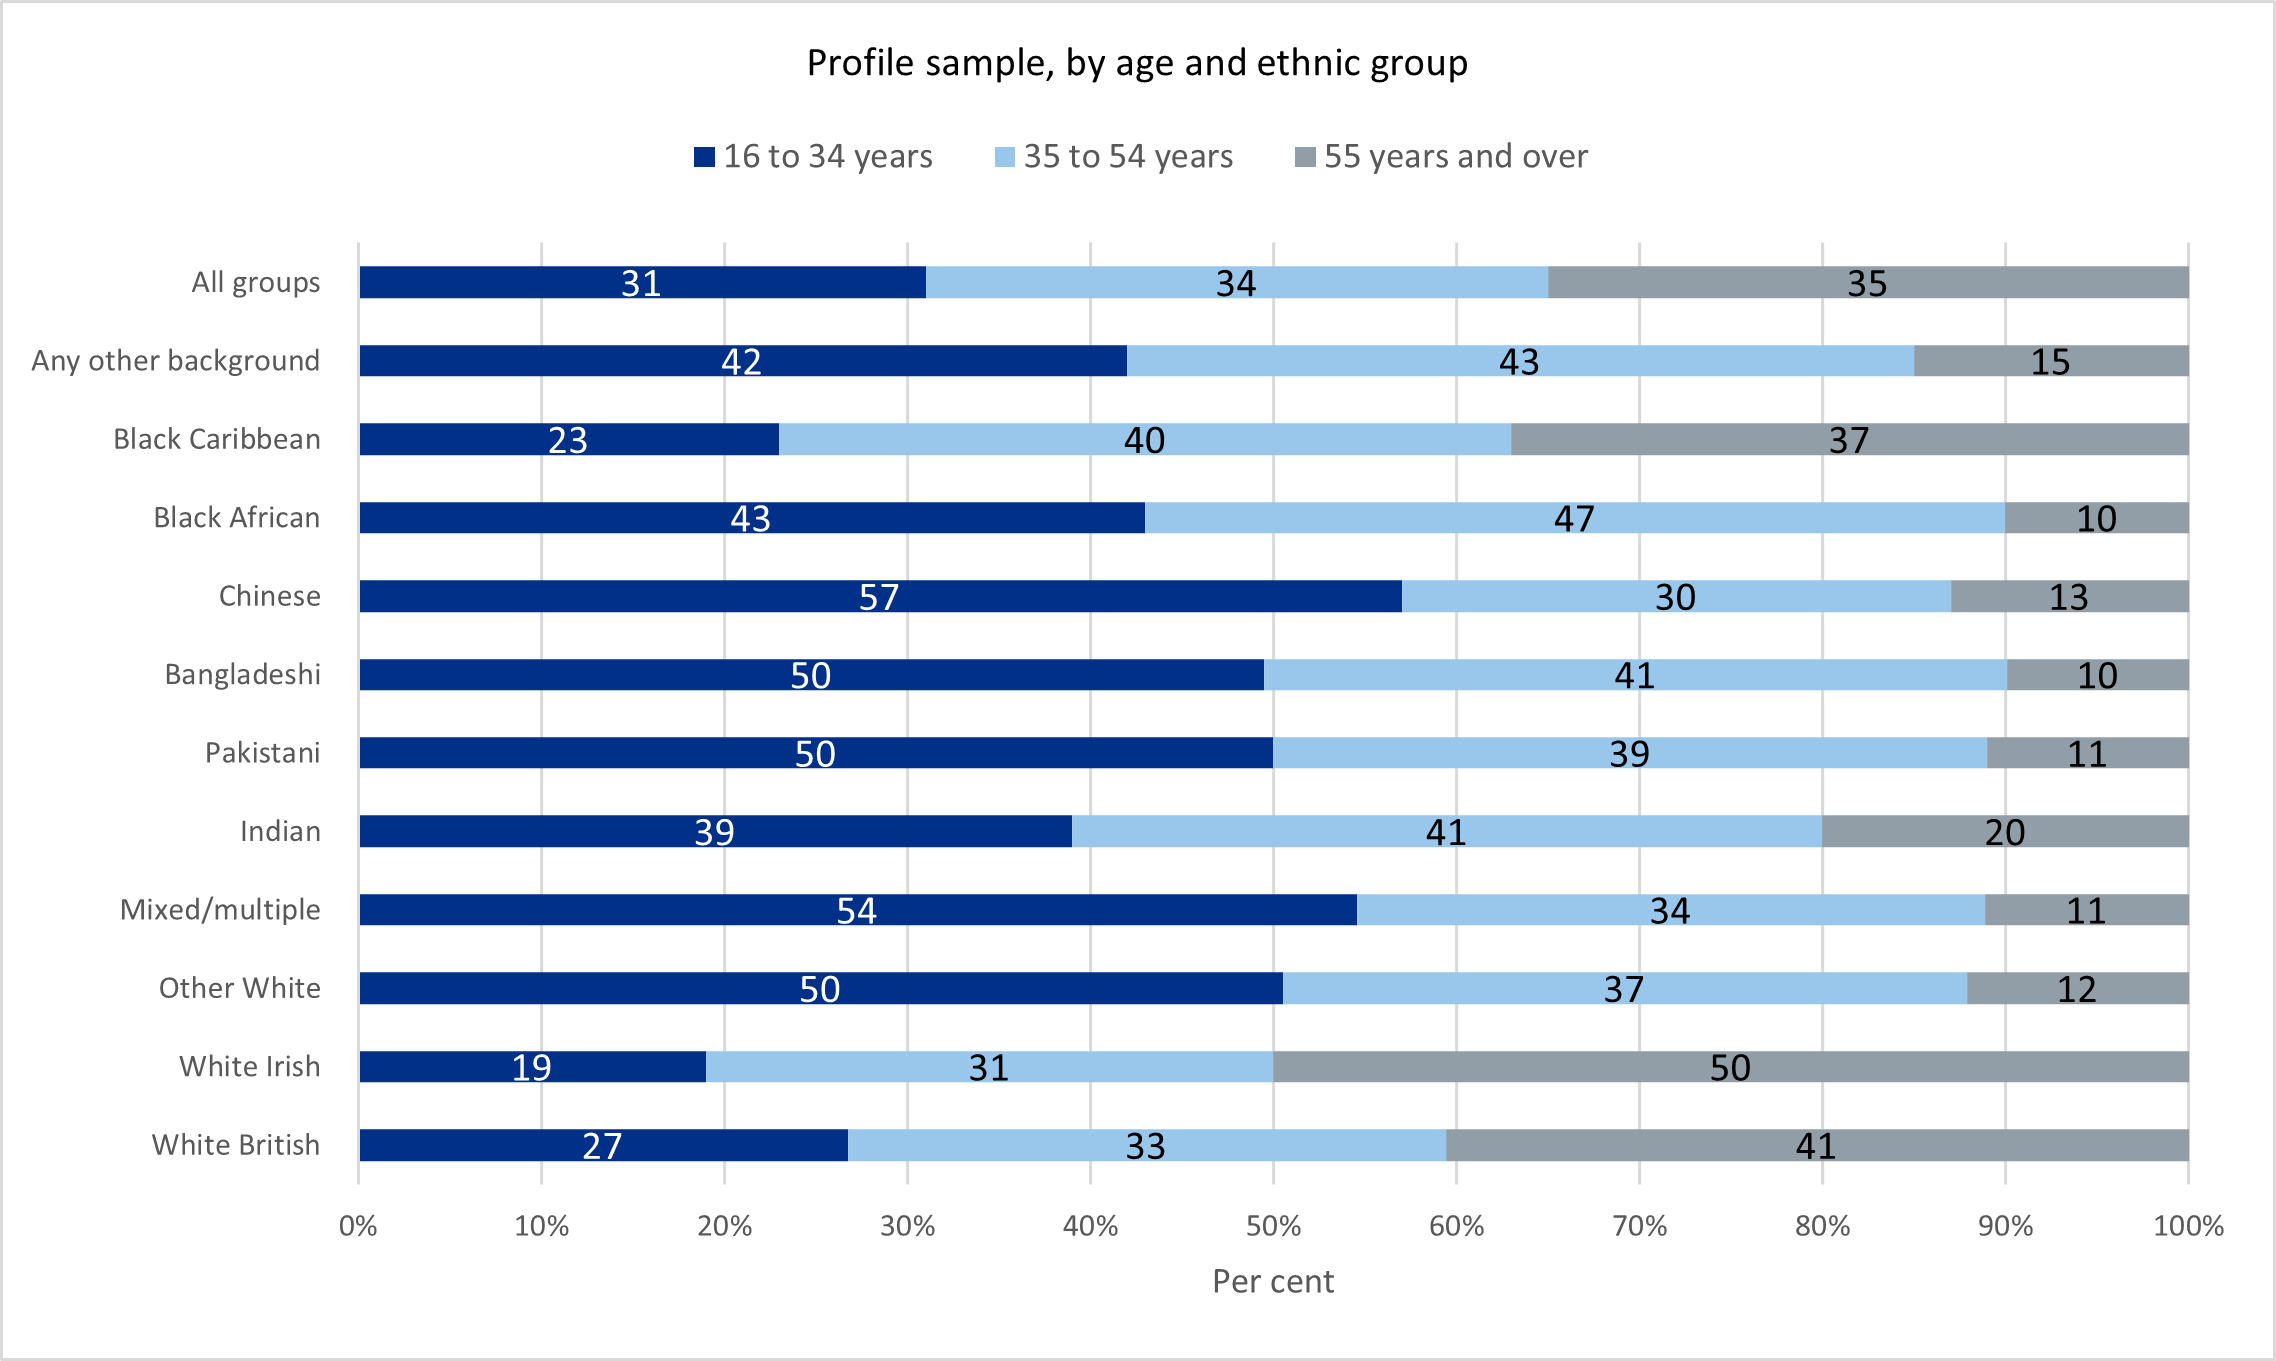
The chart below shows the age profile of the ethnic groups within the sample, after weighting.
Several minority ethnic groups had an age profile that is significantly younger than the sample in total. This was most pronounced among Chinese participants, 57% of whom were aged under 35, and was also true of those from mixed or multiple backgrounds (54%), and those from Bangladeshi, Pakistani and other white backgrounds (all 50%). All these groups, as well as the black African group, had relatively low proportions of participants aged 55 and over, between 10% and 13%.
White Irish participants were likely to be older than the sample as a whole: 19% were aged under 35, compared with 50% who were aged 55 and over.
Household income
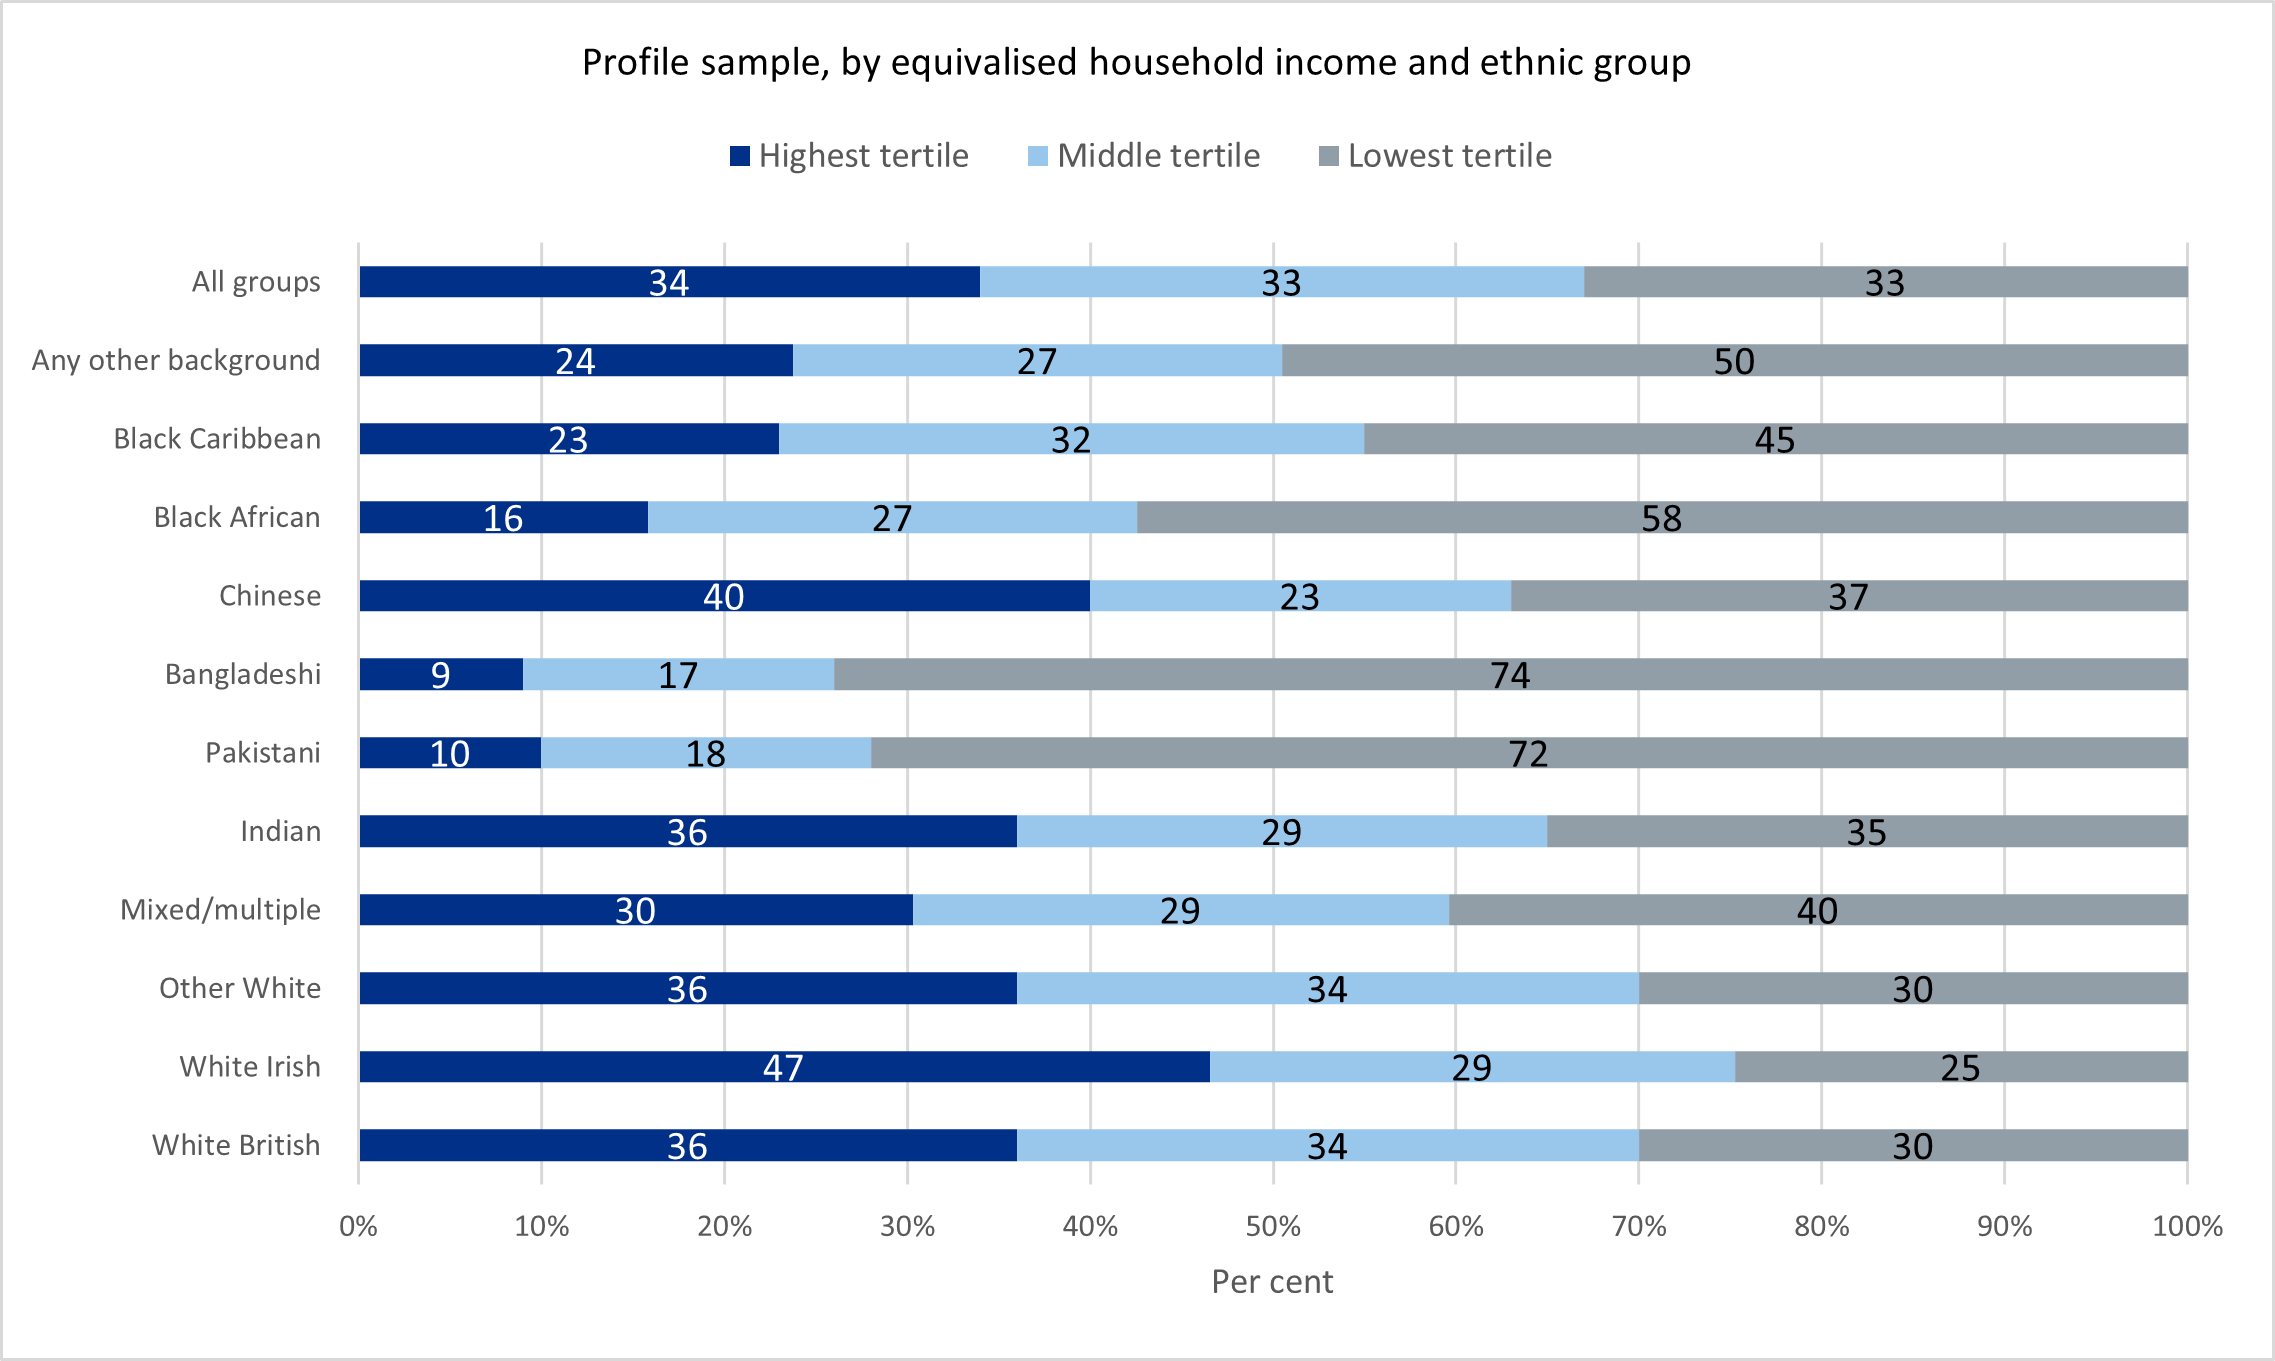
Income is also strongly linked to health status. This analysis uses equivalised household income, a measure that takes into account the size and composition of the household. It is divided into thirds (tertiles).
Personal income is likely to increase with age. Even taking this into account, the Pakistani and Bangladeshi participants were disproportionately found in the lowest income tertile (third): 74% of Bangladeshi participants and 72% of Pakistani participants. More than half (58%) of black African participants were also found in the lowest income tertile.
White Irish and Chinese participants were most likely to have higher incomes. 47% of white Irish adults and 40% of Chinese participants were within the highest income tertile.
Area deprivation
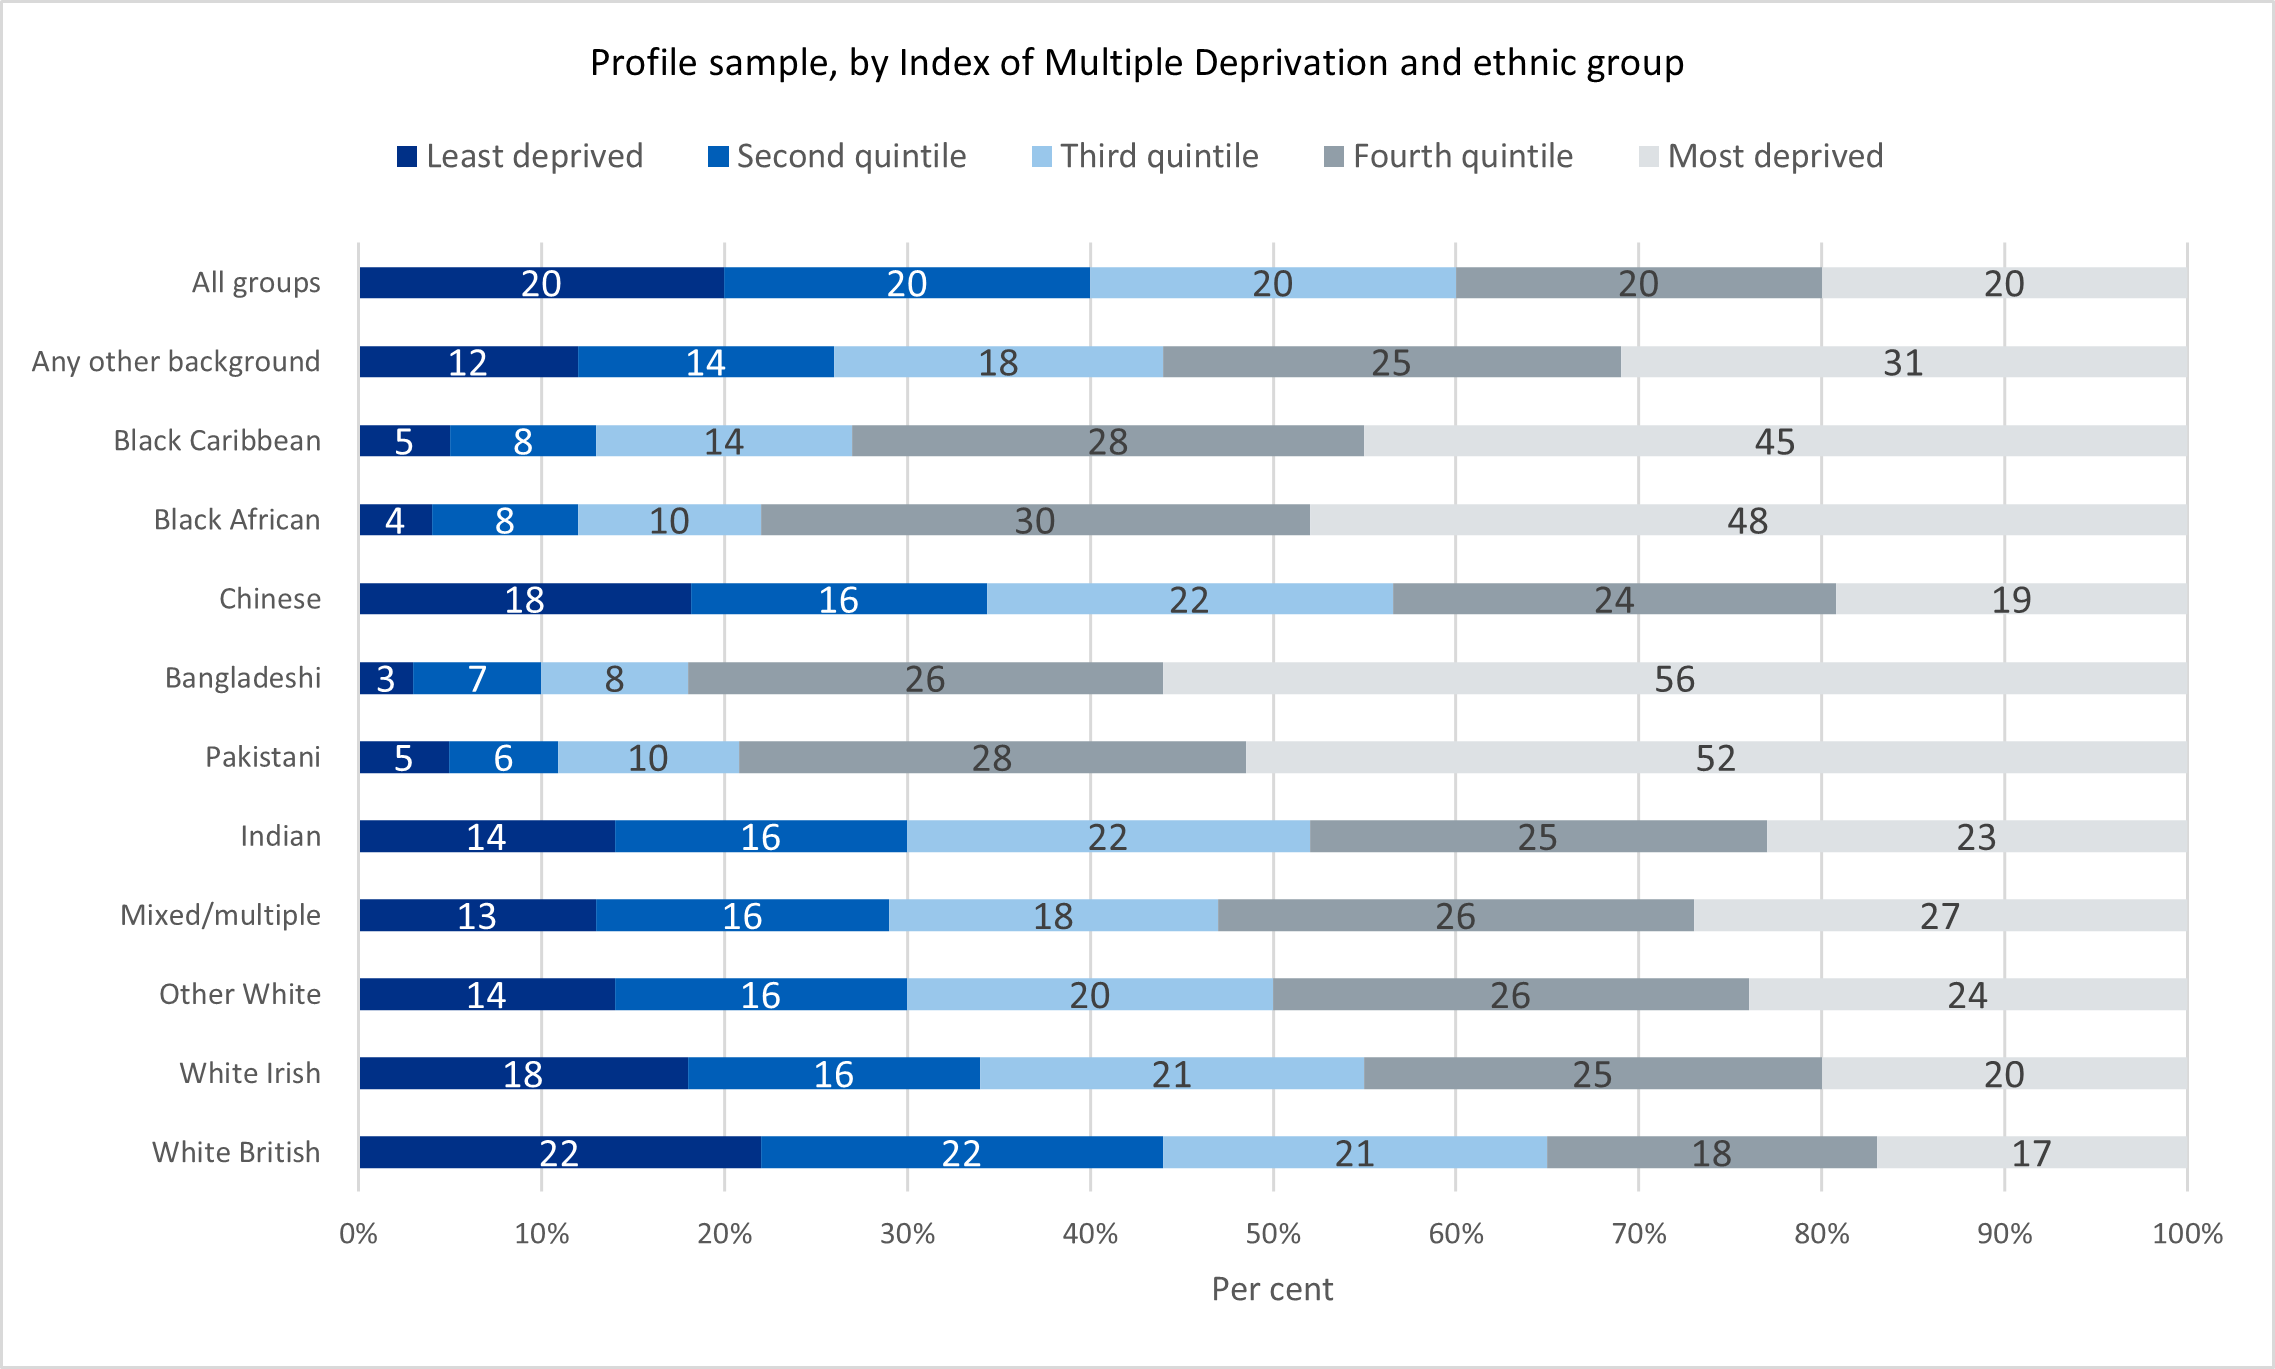
Both health status and life expectancy are strongly related to neighbourhood deprivation, with generally worsening outcomes as deprivation increases.
The HSE represents area deprivation using the English Index of Multiple Deprivation (IMD), which ranks local areas using 37 criteria, drawn from seven domains: income; employment; health and disability; education, skills and training; barriers to housing and services; living environment; and crime. The IMD is revised periodically and the IMD rankings within this data set include revisions in 2015 and 2019.
More than half of Bangladeshi and Pakistani participants lived in the most deprived quintile (fifth) of areas: 56% and 52% respectively. Black African and black Caribbean participants were also disproportionately found in the most deprived neighbourhoods.
Urban-rural classification
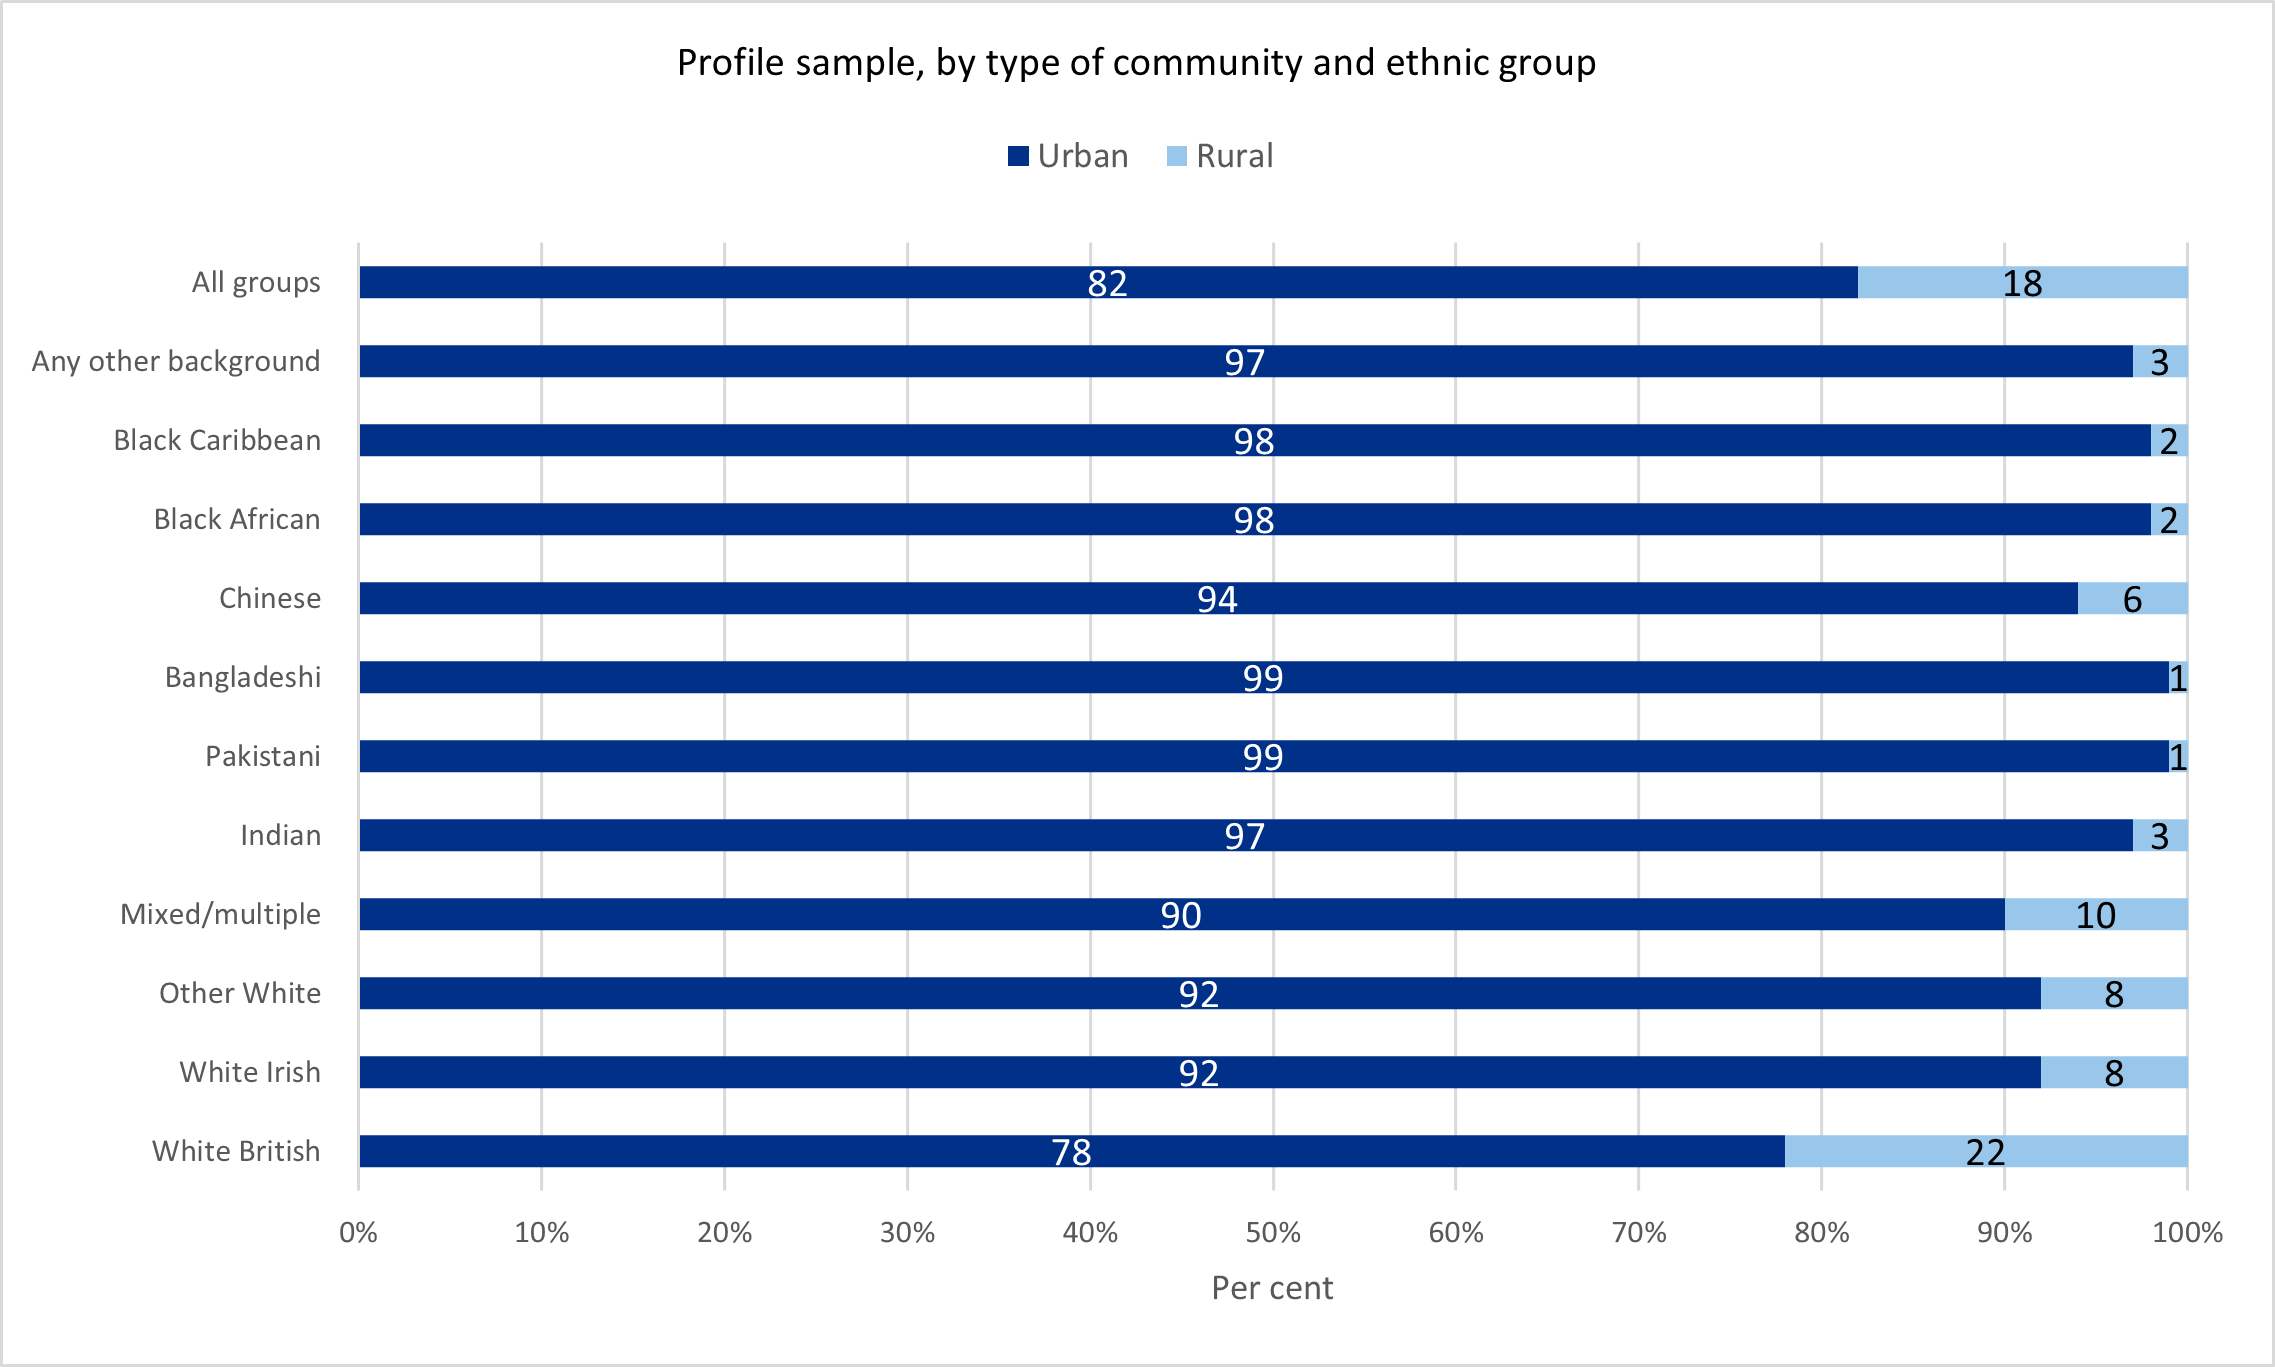
The areas in which people live are classified by whether they are urban or rural, where urban communities are defined as having a population of 10,000 or more.
Compared with white British adults, those in all minority ethnic groups were more likely to live in urban areas. 78% of white British participants lived in urban areas, compared with at least nine in ten adults in each minority ethnic group. The proportions who lived in rural areas were lowest among Pakistani and Bangladeshi adults (each 1%), black African and black Caribbean adults (each 2%) and Indian adults (3%).
Last edited: 30 June 2022 9:33 am