Publication, Part of Cancer Survival in England
Cancer Survival in England, cancers diagnosed 2016 to 2020, followed up to 2021
National statistics, Accredited official statistics
Childhood cancer survival
Childhood cancer survival is estimated using a different method to adult cancer survival, without reference to the mortality in the general population. This allows annual estimates to be calculated, although interpretation should focus on trends rather than the individual estimates. Children diagnosed with cancer between 2002 and 2020 and followed up to the end of 2021 were included.
For children (aged 0 to 14 years) diagnosed with cancer, age-standardised and non-standardised estimates of 1-year survival have improved between 2002 and 2020 which is also seen in the age group 0 to 4 years. In the age groups 5 to 9 years and 10 to 14 years, the increases are smaller from 2012 to 2018, with small decreases in 2019 and 2020.
For 5-year and 10-year estimates, survival for children aged 0 to 14 years generally improved in the earlier years in the period 2002 to 2020, with smaller increases from 2012 to 2020. This trend was observed in each group.
Childhood cancers accounted for 0.3% of all new cancer diagnoses registered in 2020. The 3 most common cancers in children were leukaemia, brain cancer and non-Hodgkin lymphoma (NHL) in 2020. Survival estimates for separate cancer sites are not available due to the small numbers of patients.
The greatest improvements over time in childhood cancer survival
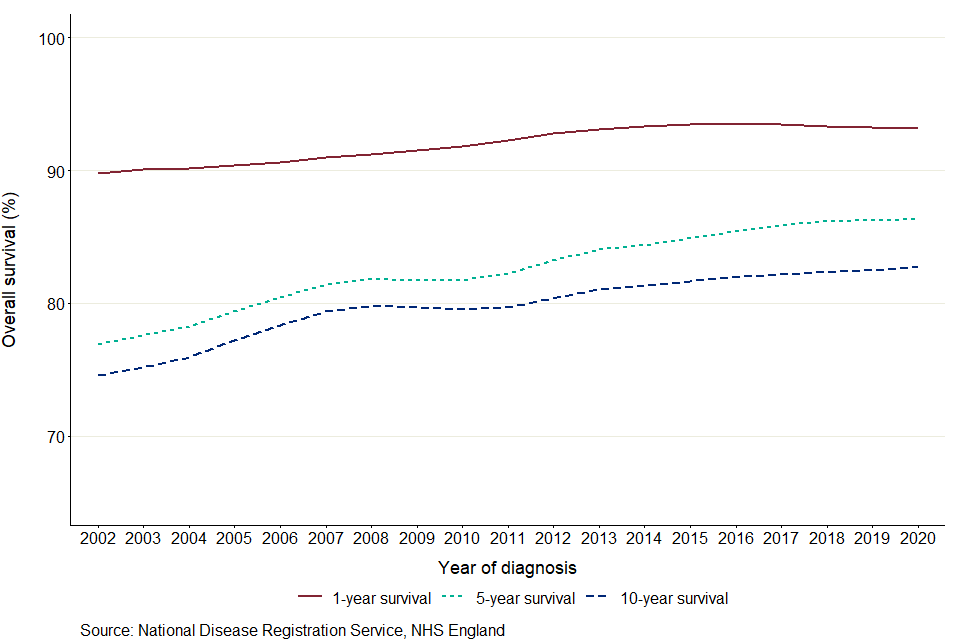
The greatest improvements over time in childhood cancer survival are seen in 5-year estimates. When comparing unsmoothed estimates, for children diagnosed with cancer, the 1-year age-standardised survival estimate was 90.7% in 2002 and was 93.3% in 2020, a difference of 2.7 percentage points. Between 2002 and 2020, 5-year survival increased by 8.4 percentage points, from 77.8% in 2002 to 86.2% in 2020. For children diagnosed in 2020, 10-year survival was 82.5%, 7.4 percentage points higher than for children diagnosed in 2002 (75.1%).
Differences between smoothed 1-, 5- and 10-year survival
As shown in Figure 10, in 2020, the 1-year smoothed age-standardised survival estimate for all ages (0 to 14 years) combined is 7.1 percentage points higher than the 5-year survival estimate, which is 3.6 percentage points higher than the 10-year survival estimate. This is an improvement from 2002 where 1-year survival was 12.9 percentage points higher than the 5-year survival estimate, which was 2.3 percentage points higher than the 10-year survival estimate. The smaller difference between 5-year and 10-year survival means that children who survive for 5 years often live at least a further 5 years after diagnosis.
Figure 10: Smoothed trends in 1-, 5- and 10-year age-standardised survival (%) for children (aged 0 to 14 years) diagnosed with cancer in England in the period 2002 to 2020 and followed up to 2021
Notes:
-
Age-standardised survival estimates are presented for all children (aged 0 to 14 years).
-
The survival estimates were smoothed by applying the ‘lowess’ technique (locally weighted scatterplot smoothing) because of wide year-to-year variation (due to sparse data) in childhood survival. The smoothed data are used to highlight temporal trends in survival.
-
1-year survival estimates from 2002 to 2020 are based on the cohort method.
-
5-year survival estimates from 2002 to 2020 are based on the following methods: cohort from 2002 to 2016 and period from 2017 to 2020.
-
10-year survival estimates from 2002 to 2020 are based on the following methods: cohort from 2002 to 2011 and period from 2012 to 2020.
Last edited: 19 April 2023 12:39 pm