Publication, Part of Cancer Survival in England
Cancer Survival in England, cancers diagnosed 2016 to 2020, followed up to 2021
National statistics, Accredited official statistics
Cancer survival by stage
Stage at diagnosis of cancer is an important factor that affects cancer outcomes. Earlier diagnosis, that is, when cancers are diagnosed at stages 1 and 2 as opposed to stages 3 and 4, is usually associated with better prognosis on average.
Net survival estimates by stage at diagnosis for 1- and 5-years are presented for 23 cancer sites/groups. Estimates by stage are not available for brain cancer, cervix cancer, non-Hodgkin lymphoma (including diffuse large B-cell lymphoma and follicular lymphoma), leukaemia (including myeloid leukaemia), pancreatic cancer, small intestine cancer, stomach cancer and thyroid cancer.
This is because of complexities within different subtypes of a cancer site or because staging systems do not exist for all or some subtypes of the cancer. For some cancers, survival estimates by stage at diagnosis were not reliable enough to present and have not been included in the commentary or data tables.
Cancer survival varies by cancer site/group and by stage at diagnosis. The range in 5-year age-standardised net survival for all stages combined is from 11.8% (liver cancer for females) to 94.6% (melanoma of skin for females).
The range in 5-year age-standardised net survival by stage ranges from 3.5% (stage 4 lung cancer for males) to 101.1% (stage 1 melanoma for females). A survival of over 100% means fewer people are dying than would be expected in the general population, see the Interpretation of these statistics chapter for more details.
Net survival for all stages combined is affected by the proportion of cases diagnosed at each stage, which varies considerably by cancer site/group. For some cancer sites/groups, the survival for all stages combined is close to that for early stage diagnoses, for example, uterus cancer. While for other cancer sites/groups it is closer to that for later stage diagnoses, for example, bowel cancer.
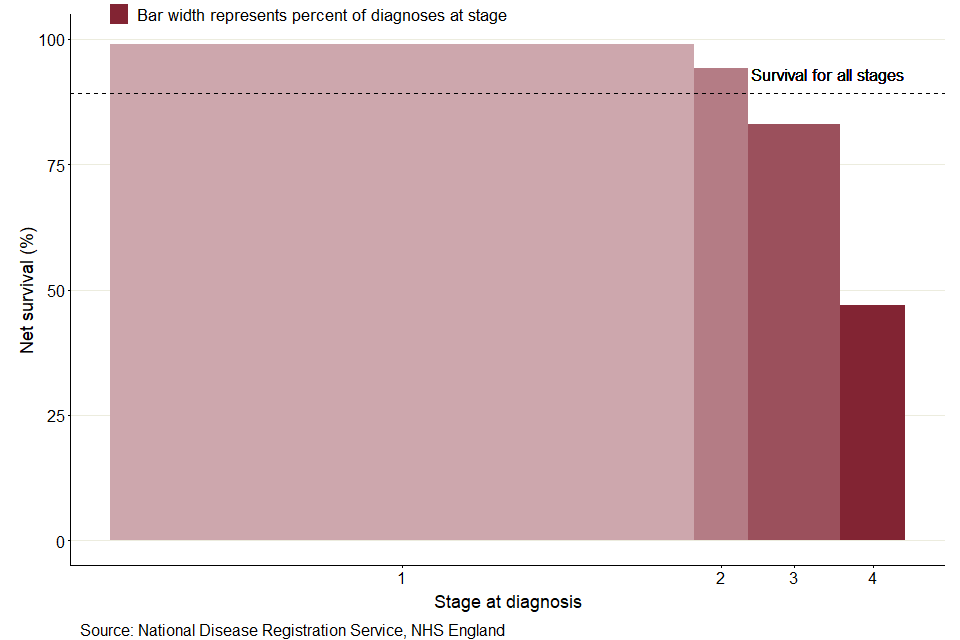
Figure 3: 1-year age-standardised net survival for uterus cancer by stage at diagnosis, females, diagnosed in the period 2016 to 2020 and followed up to 2021
Notes:
- Survival estimates were age-standardised using a standard set of age-specific weights.
- The dotted line represents survival for all stages combined including unstageable and missing.
- International Classification of Diseases 10th Revision (ICD-10) was used to classify cancer sites.
As shown in Figure 3, for uterus cancer, 1-year net survival for all stages combined (89.3 %) is slightly below that of stages 1 (98.9%) and 2 (94.3%) compared to stages 3 (82.9%) and 4 (47.0%). This is largely influenced by the fact that over two-thirds of females with a staged tumour were diagnosed at stage 1 (73.4%).
Figure 4: 1-year age-standardised net survival for bowel cancer by stage at diagnosis, persons, diagnosed in the period 2016 to 2020 and followed up to 2021

Notes:
- Survival estimates were age-standardised using a standard set of age-specific weights.
- The dotted line represents survival for all stages combined including unstageable and missing.
- International Classification of Diseases 10th Revision (ICD-10) was used to classify cancer sites.
As shown in Figure 4, in contrast, for all stages combined, 1-year net survival (78.5%) for bowel cancer falls between survival for stages 3 (89.2%) and 4 (43.6%). While the proportion of known staged bowel cancer cases is more evenly spread than uterus cancer, stage 1 (18.3%), stage 2 (25.4%), stage 3 (30.7%), the proportion diagnosed at stage 4 (25.7%) is much higher than for uterus cancer (8.2%).
Last edited: 19 April 2023 12:39 pm