Publication, Part of National Child Measurement Programme
National Child Measurement Programme, England, 2022/23 School Year
Official statistics, National statistics, Accredited official statistics
Introduction section
Small changes have been made to the Introduction section to improve the clarity of the wording around use of growth reference data, and of population monitoring cut offs.
8 October 2025 11:26 AM
Part 2: Geography
Region
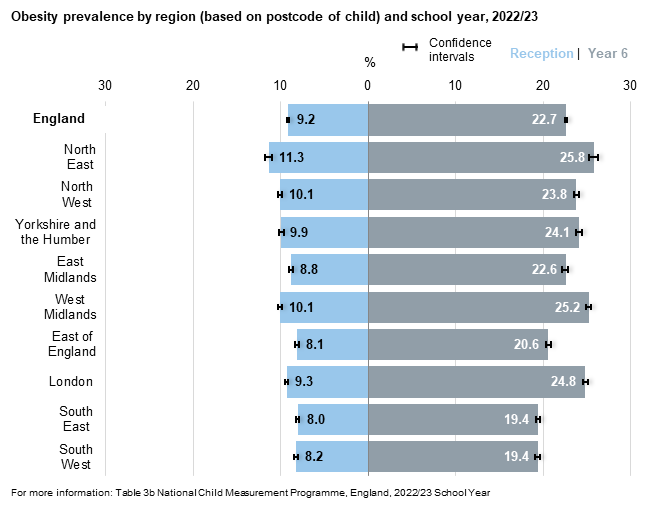
In reception, the prevalence of obesity in 2022/23 was highest in the North East (11.3%). It was lowest in the South East (8.0%), East of England (8.1%) and South West (8.2%).
In year 6, the prevalence of obesity in 2022/23 was highest in the North East (25.8%), the West Midlands (25.2%) and London (24.8%). It was lowest in the South West (19.4%) and the South East (19.4%).
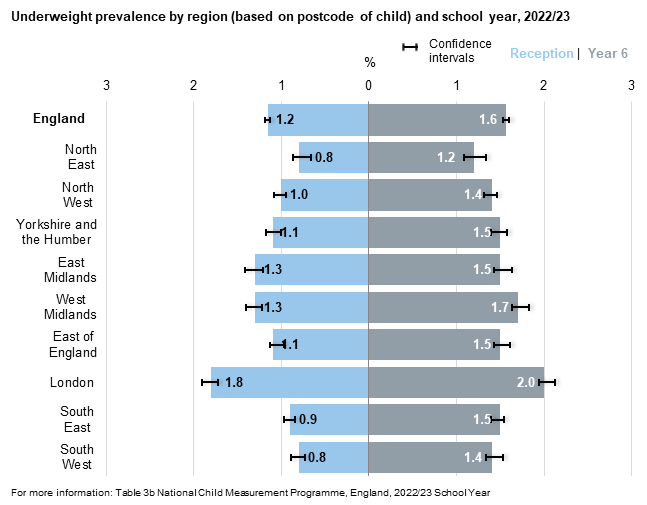
Underweight prevalence was highest in London for both reception at 1.8% and year 6 at 2.0%.
Local authority
Obesity prevalence varied by local authority.
For reception this ranged from 4.9% in Wokingham to 14.1% in Knowsley.
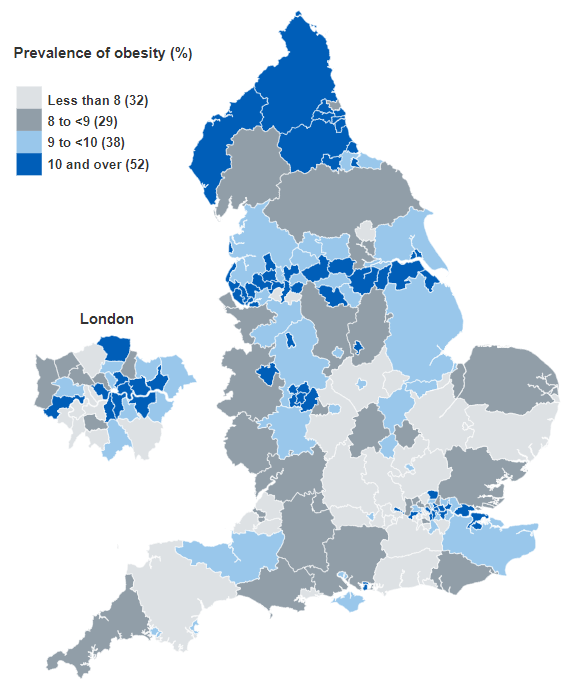
In year 6 the range was from 12.0% in Richmond upon Thames, to 31.7% in Barking and Dagenham.

Note the maps cannot be compared with each other due to the different ranges used.
For more information: Table 3b UTLA, National Child Measurement Programme: England, 2022/23 school year.
Rurality
Obesity prevalence was highest in urban areas for both age groups: 9.4% in reception and 23.6% in year 6.
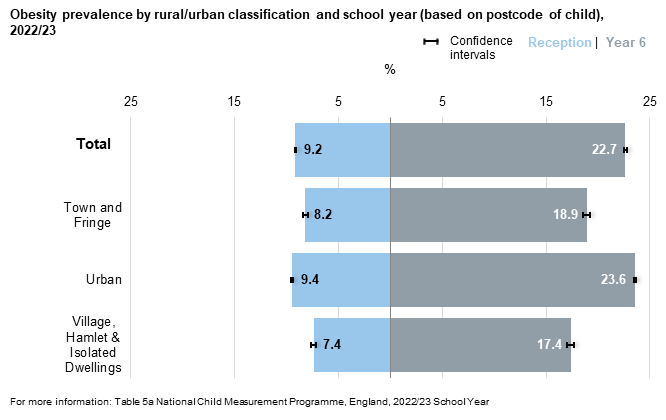
Underweight prevalence was also highest in urban areas: 1.3% in reception and 1.6% in year 6.
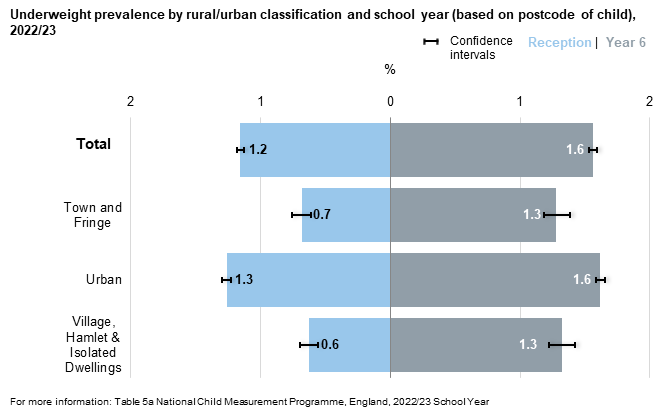
For more information: Table 5a, National Child Measurement Programme: England, 2022/23 school year.
ONS Area Classification
In both reception and year 6, obesity prevalence was highest in disadvantaged urban communities (12.1% and 29.0% respectively) and lowest in urban fringe areas (6.6% and 15.7%).
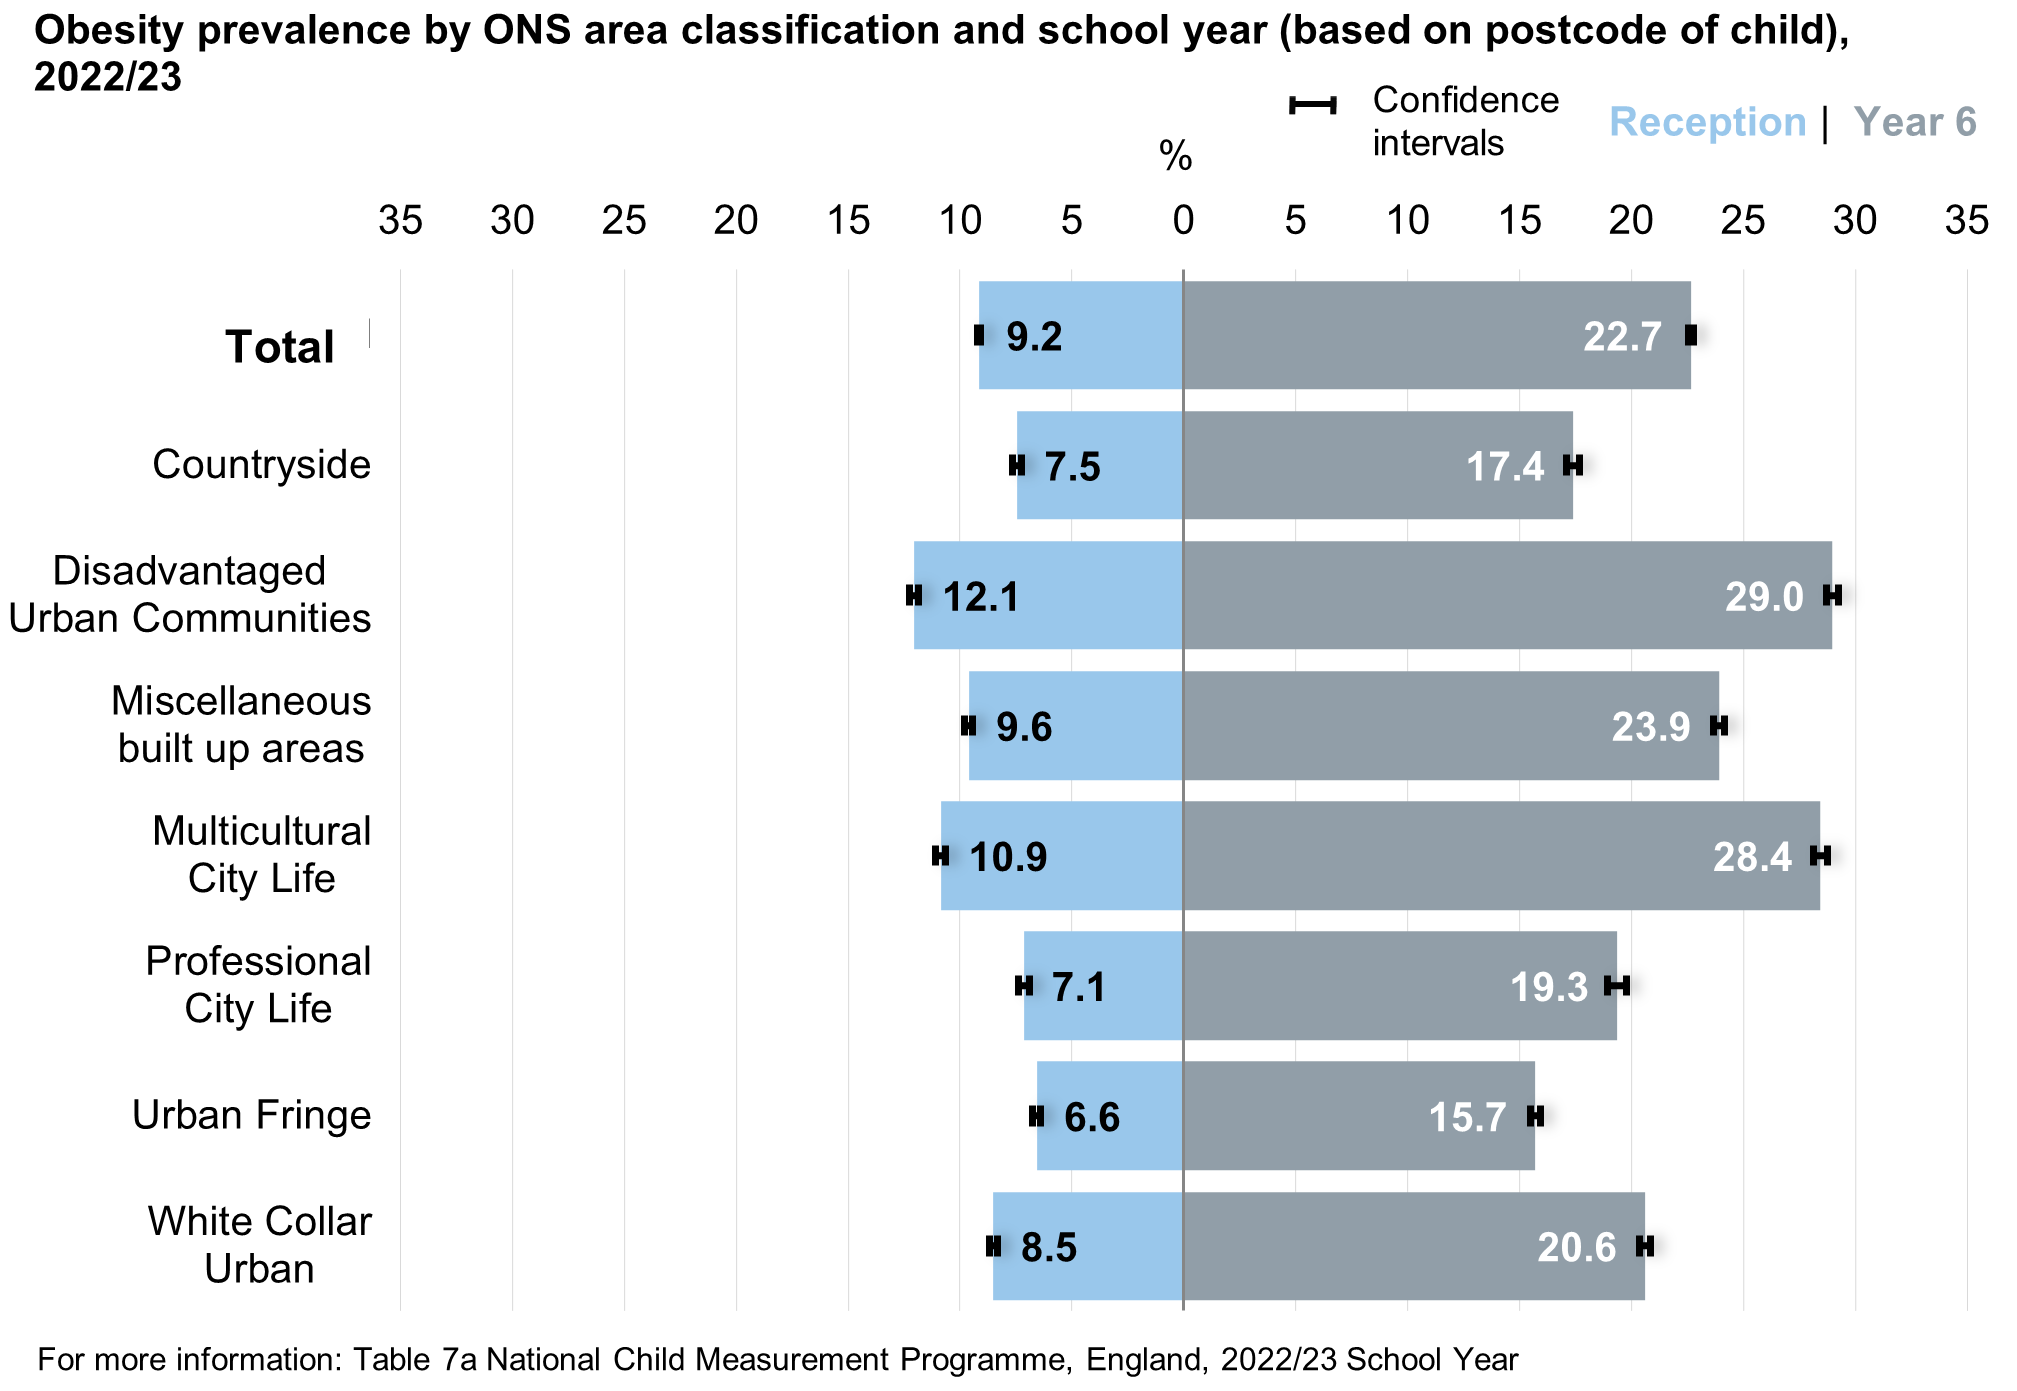
Underweight prevalence was highest in multicultural city life areas for both age groups: 2.2% for reception and 2.4% for year 6.
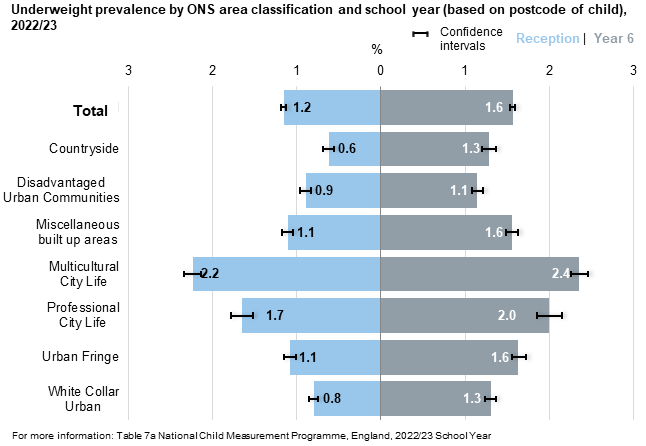
For more information: Table 7a, National Child Measurement Programme, England, 2022/23 school year.
ONS Area classifications use census data to identify areas of the country with similar characteristics. For further details see:
Last edited: 8 October 2025 11:26 am