Publication, Part of National Child Measurement Programme
National Child Measurement Programme, England, 2022/23 School Year
Official statistics, National statistics, Accredited official statistics
Introduction section
Small changes have been made to the Introduction section to improve the clarity of the wording around use of growth reference data, and of population monitoring cut offs.
8 October 2025 11:26 AM
Part 3: Ethnicity
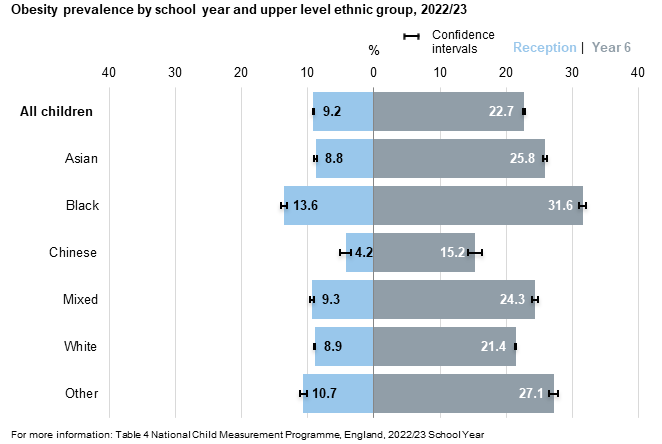
In both reception and year 6, the proportion of children living with obesity was highest for Black children (13.6% and 31.6% respectively) and lowest for Chinese children (4.2% and 15.2% respectively).
The proportion of children who were underweight was highest for Asian children in both reception and year 6 (4.3% and 3.8% respectively).
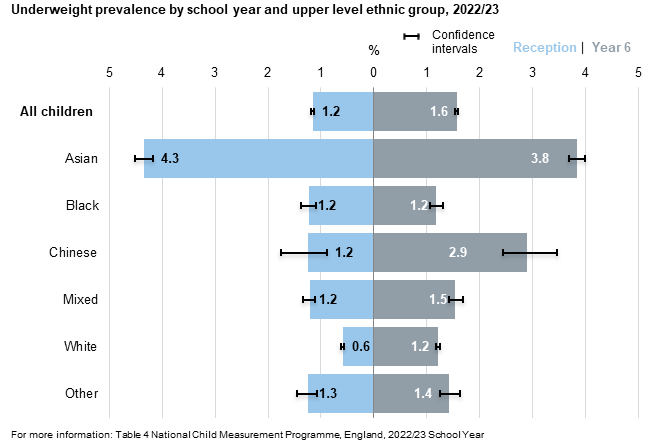
Ethnic categories displayed here have been derived by combining lower level NHS ethnic categories. The lower level breakdown is available in table 4.
For more information: Table 4, National Child Measurement Programme: England, 2022/23 school year.
Last edited: 8 October 2025 11:26 am