Publication, Part of Adult Psychiatric Morbidity Survey: Survey of Mental Health and Wellbeing, England
Adult Psychiatric Morbidity Survey: Survey of Mental Health and Wellbeing, England, 2023/4
Accredited official statistics
Chapter 5: Alcohol: hazardous, harmful and dependent patterns of drinking
Overview
This chapter describes the prevalence of hazardous, harmful and dependent patterns of drinking in the general population. As in 2014, all participants in 2023/4 completed the Alcohol Use Disorders Identification Test (AUDIT) questionnaire in the self-completion part of the interview. The AUDIT was used to screen for clinically relevant alcohol use disorders, including alcohol dependence.
Key findings
- 18.0% of adults drank at hazardous levels or above, as indicated by an Alcohol Use Disorders Identification Test (AUDIT) score of 8 or more. 1.8% scored 16 to 19, indicating harmful levels of drinking, and 0.9% scored 20 or more, indicating probable alcohol dependence. One in four (23.6%) had not drunk alcohol in the past year.
- Drinking at hazardous levels or above (AUDIT 8+) varied by gender and age. Men (24.8%) were twice as likely as women (11.7%) to drink at this level. Adults aged 75 and over were less likely to drink at hazardous levels or above (10.2%) than other age groups (ranging from 15.6% in 65 to 74 year olds to 21.0% in 55 to 64 year olds).
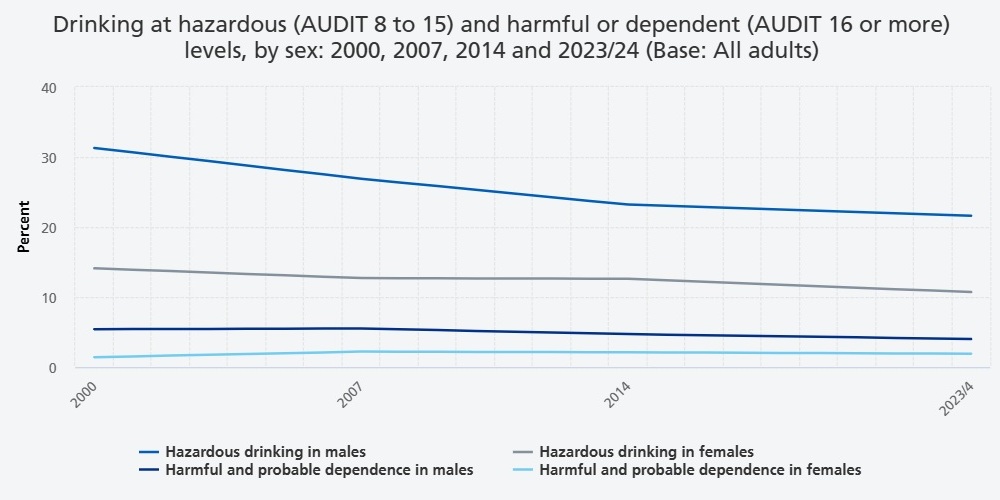
- Overall, drinking at hazardous levels or above fell in prevalence from 26.1% of 16 to 74 year olds in 2000 to 18.9% in 2023/4. The decline was evident in both male (36.8% in 2000, 25.6% in 2023/4) and female (15.5% in 2000, 12.6% in 2023/4) participants.
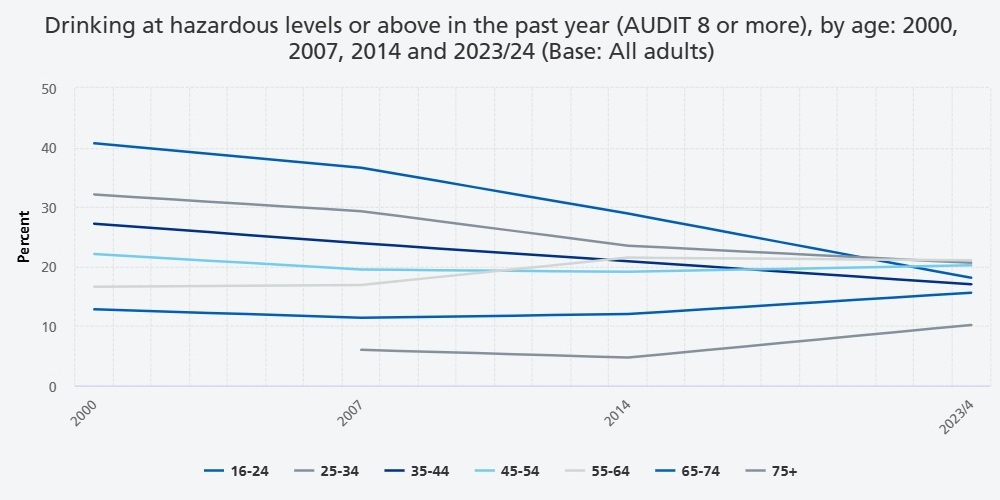
- Trends in drinking at hazardous levels or above varied markedly by age group. Prevalence halved among 16 to 24 year olds (40.7% in 2000, 18.1% in 2023/4) and also fell among those aged 25 to 34 and 35 to 44. In contrast, the proportion of adults aged 45 to 54, 55 to 64, and 65 to 74 drinking at this level did not change between 2000 and 2023/4, and data available for adults aged 75 and over indicates an increase in this group from 6.0% (CI 4.6, 7.7) in 2007 to 10.2% (CI 8.2, 12.6) in 2023/4.
- Drinking at hazardous levels or above was more prevalent in more affluent areas. 23.5% of adults living in the least deprived quintile of areas drank at hazardous levels or above, compared with 16.5% of adults in the most deprived areas. Prevalence also varied by region (and was highest in the North of England) and by ethnicity (and was highest among White British adults).
- Having a common mental health condition (CMHC) was associated with drinking at harmful and dependent levels. 3.0% of adults with a CMHC were drinking at harmful levels (AUDIT 16-19) and 2.3% had probable dependence (AUDIT 20+), compared with 1.4% and 0.6% of those without a CMHC.
- Most adults with probable alcohol dependence had not received treatment related to their drinking. 43.3% of adults with an AUDIT score of 20 or more reported receiving treatment or support for drinking at some point in their life. This mostly comprised self-help or peer support (30.6%), counselling (20.9%), and detoxification or rehabilitation (13.4%).
5.1 Introduction
The impact of alcohol consumption
In England, drinks containing alcohol are widely available and consumed by the majority of the adult population (NHS England 2024a). Alcohol is responsible for a considerable degree of health and social harm. Alcohol-related harms exist on a continuum, and include acute and chronic health and social consequences, as well as harm to people other than the drinker. According to the World Health Organization (WHO), alcohol is wholly or partly responsible for over 200 different disease conditions (WHO 2024). Alcohol is identified as a Grade 1 carcinogen (the most carcinogenic type) and, in 2019/20, was responsible for over 4% of all new cancer cases worldwide (WHO 2024; Rumgay et al. 2021). Excessive alcohol consumption is a leading cause of disability in the UK and Europe (GBD 2016 Alcohol Collaborators 2018; Forouzanfar et al. 2016).
Acute harms from alcohol include accidents, injuries, collapse, self-harm and in severe cases, acute alcohol poisoning. Alcohol use does not only harm those who drink. In 2022, 5% of all road traffic accidents and 18% of all deaths reported in road traffic accidents involved at least one driver over the drink-driving limit (Department for Transport 2024). In the year ending March 2024 alcohol use was related to 39% of violent incidents in England and Wales (Office for National Statistics (ONS) 2025). Alcohol misuse is associated with both domestic violence and marital breakdown, and children of problem drinkers are more likely to suffer emotional and behavioural problems, and to perform poorly at school (Cuijpers et al. 2006).
Alcohol misuse often co-exists with common mental disorders, such as depression and anxiety, as well as with use of other substances (Grant et al. 2004; Weich et al. 2011; McManus et al. 2016; Awaworyi Churchill and Farrell 2017; Puddephatt et al. 2021). High levels of hazardous and dependent drinking have been recorded in people with serious mental health problems, while non-drinking was also more common in people with psychosis (Puddephatt et al. 2023). Alcohol dependence and other problems associated with alcohol use are also frequent in homeless people and prisoners, again often in combination with poor mental health (Drummond et al. 2008; Light et al. 2013).
In 2023/24, there were 280,750 estimated admissions where the main reason for hospital admission was primarily attributable to alcohol (described as the ‘narrow measure’). The most common causes of admissions attributable to alcohol were for cancer (85,400), followed by cardiovascular disease (41,430) and mental and behavioural disorders due to use of alcohol (34,810). A further 193,660 were partially attributable to alcohol (using the ‘broad measure’) (Department of Health and Social Care 2025). In 2023, there were 8,274 alcohol-specific deaths, the highest rate since 2006 and 4.6% higher than 2022 (Office for Health Improvement and Disparities 2024).
In 2024, it was estimated that the cost of alcohol harm in England was £27.44 billion a year; as well as costs to the health service, this included the costs of crime and disorder, reduced workplace productivity, unemployment and social services (Institute of Alcohol Studies 2024).
Policy and guidance
In recent years, the government has acknowledged the significant social, economic, and health costs of alcohol misuse, which remains a key public health focus. In 2012, the UK Chief Medical Officer published guidelines on alcohol, based on the recommendation of an expert review of the association between alcohol consumption and health harms (Department of Health 2012). This review identified a lower beneficial effect of alcohol and evidence of a stronger association with certain types of cancer and other health harms than was previously identified. Based on this evidence, the guidelines advised that for both men and women, it is safest not to drink more than 14 UK units of alcohol per week (112g of pure ethanol), and within that to avoid alcohol binges by spreading drinking over 3 or more days per week. Drinking above the recommended limits and alcohol binges would be categorised as hazardous levels of drinking and above using the AUDIT. The revised advice in pregnancy is that the safest approach is to abstain.
In 2012, the UK government initiated a significant shift in the commissioning of drug and alcohol services, transferring responsibilities from the NHS to local authorities. This change was part of the broader reforms introduced by the Health and Social Care Act 2012, which aimed to decentralise public health functions and integrate them more closely with local governance. A study published by Roberts and colleagues in 2020 indicated that since then there was a year-on-year increase in alcohol-related hospital admissions and year-on-year reductions in the number of adults entering specialist treatment and net local authority expenditure for treatment of alcohol misuse (Roberts et al. 2020).
In 2021, the UK government launched a 10-year drug strategy From Harm to Hope, which included improvements to treatment for drug and alcohol use. This included proposals to enhance the skills of the workforce in relation to drug and alcohol treatments, reduce staff caseloads, provide 54,500 new drug and alcohol treatment places, integrate physical and mental health care with substance misuse services and to improve access to treatment for adults experiencing multiple disadvantage (including combinations of homelessness, addiction, mental ill health, domestic abuse and contact with the criminal justice system) (HM Government 2021).
The National Institute for Health and Care Excellence (NICE) recommends referral for specialist treatment for adults with features of alcohol dependence or signs of severe alcohol-related impairment. Primary care management should include offering advice on alcohol consumption or a brief intervention, including psychological interventions. Pharmacological interventions could be offered to harmful drinkers and people with mild alcohol dependence who have not responded to psychological interventions alone, or who have specifically requested a pharmacological intervention (NICE 2011, updated 2014).
5.2 Definitions and assessments
‘Alcohol use disorders’ encompass a range of conditions defined in the ICD-11 (WHO 2019). In this chapter we consider ‘harmful alcohol use’ (an established pattern of drinking causing damage to health) and ‘alcohol dependence’ (including signs of addiction to alcohol). We also consider hazardous drinking (an established pattern of drinking which increases the risk of health harm). Despite changes in diagnostic systems from ICD-10 to ICD-11 (WHO 1993, 2019), the way in which alcohol use disorders have been measured on APMS since 2000 has remained consistent.
Initial questions about alcohol consumption were asked by the interviewer either face to face or via telephone. Additional questions were asked of non-drinkers to establish if they had ever been a drinker and reasons for not drinking now. All participants who drank alcohol now, even if just occasionally, were routed to the remaining alcohol use questions. These were administered in the self-completion section of the interview, consistent with the approach used in APMS since 2000.
The Alcohol Use Disorders Identification Test (AUDIT) (Saunders et al. 1993) is a questionnaire used to measure, identify and categorise clinically relevant alcohol use disorders, including alcohol dependence. The AUDIT takes the year before the interview as a reference period, consists of 10 items and includes questions on alcohol consumption, measuring the social impact of alcohol consumption, symptoms of alcohol dependence and whether friends or health professionals have suggested a need to cut down. Questions were also asked about treatment or support received in relation to drinking.
The AUDIT score thresholds used in this chapter are as follows:
|
AUDIT score |
Category description |
|
0 |
Non-drinkers |
|
1 to 7 |
Low risk drinking |
|
8 to 15 |
Hazardous drinking (also known as ‘increasing risk’) |
|
16 to 19 |
Harmful drinking (also known as ‘higher risk’) |
|
20 or above |
Probable dependence |
An AUDIT score of 8-15 suggests probable need of brief alcohol intervention (e.g. in primary care); those scoring 16-19 may warrant an 'extended brief intervention' and referral to specialist treatment for those who don’t respond to the initial intervention (stepped care); 20+ indicates a need for referral to specialist services for further assessment and treatment (Office for Health Improvement and Disparities 2023). Surveys tend to under-estimate the 20+ population due to sampling and participation issues (Boniface et al. 2014).
An AUDIT score of 8 or more is used in this chapter to indicate ‘drinking at hazardous levels or above’, and a score of 16 or more to denote ‘drinking at harmful or dependent levels’.
5.3 Results
Prevalence of hazardous, harmful or dependent drinking, by age and gender
In 2023/4, the majority (82.0%) of adults had either not drunk alcohol in the past year (23.6%) or had a low risk pattern of drinking behaviour (AUDIT 1-7) (58.4%).
The proportion of adults who drank at hazardous levels or above (AUDIT 8+) was 18.0%:
- 15.3% of adults drank at hazardous levels (AUDIT 8-15)
- 1.8% had a harmful pattern of drinking behaviour (AUDIT 16-19)
- 0.9% had probable alcohol dependence (AUDIT 20+).
If all adults in the population had been screened, it is likely that the proportion drinking at hazardous levels or above (AUDIT 8+) would have been between 16.7% and 19.4% (referred to as the 95% confidence interval (CI)). This is equivalent to an estimated 8.4 million adults in England. The estimated proportion of drinking at harmful or dependent levels (2.7%) would have been between 2.2% and 3.4% if all adults in the population had been screened, equivalent to an estimated 1.3 million adults in England.
Drinking patterns varied by gender. Men (24.8%, 95% CI 22.6, 27.1) were twice as likely as women (11.7%, CI 10.3, 13.2) to drink at hazardous levels or above (AUDIT 8+). Men (3.8%, CI 2.9, 5.0) were also twice as likely as women (1.7%, CI 1.2, 2.4) to drink at harmful levels or above (AUDIT 16+).
Drinking at hazardous levels or above (AUDIT 8+) varied by age. Prevalence was lowest among those aged 75 or over (10.2%, CI 8.1, 12.8), and broadly similar across other age groups. The pattern of association between drinking at hazardous levels or above and age did not significantly differ between men and women.
Drinking at harmful levels or above (AUDIT 16+) varied by age, with prevalence highest among adults aged 25 to 34 (3.7%, CI 2.2, 6.1), 35 to 44 (3.7%, CI 2.4, 5.6), and 45 to 54 (3.9%, CI 2.6, 5.8) and lowest among those aged 75 and over (0.9%, CI 0.4, 2.5).
Probable alcohol dependence (AUDIT 20+) also varied by age. Prevalence was highest for adults aged 35 to 44 (1.4%, CI 0.8, 2.3) and 45 to 54 (1.8%, CI 1.0, 3.1). No participants aged 16 to 24 were identified with probable alcohol dependence.
For more information: Table 5.1 and Table A1 for confidence intervals
Trends in hazardous, harmful or dependent drinking, 2000 to 2023/4
Note that the trends in this chapter are based on 16 to 74 year olds, to allow for comparison with 2000, and analysed by sex (male and female) rather than gender (men and women). See How to interpret the findings for information on how changes over time were assessed.
Hazardous levels or above
Drinking at hazardous levels or above (AUDIT 8+) fell in prevalence over time, from 26.1% (95% CI 24.8, 27.5) of 16 to 74 year olds in 2000, 23.5% (CI 22.3, 24.8) in 2007 and 21.3% (CI 20.0, 22.5) in 2014, to 18.9% (CI 17.5, 20.5) in 2023/4. Prevalence overall fell among both male (36.8%, CI 34.7, 38.8 in 2000; 25.6%, CI 23.3, 28.0 in 2023/4) and female (15.5%, CI 14.3, 16.8 in 2000; 12.6%, CI 11.1, 14.2 in 2023/4) 16 to 74 year olds.
The decline since 2000 has been driven by changes in the drinking patterns of younger adults. Prevalence more than halved among male 16 to 24 year olds (51.3%, CI 44.9, 57.7 in 2000; 19.6%, CI 12.5, 29.3 in 2023/4) and almost halved among female 16 to 24 year olds (29.9% in 2000, CI 24.9, 35.4; 16.8%, CI 10.4, 25.8 in 2023/4). Among 25 to 34 year olds, drinking at this level fell from 32.1% (CI 29.5, 34.9) in 2000 to 20.6% (CI 17.1, 24.7) in 2023/4, and in 35 to 44 year olds it fell from 27.2% (CI 24.9, 29.7) in 2000 to 17.0% (CI 14.4, 20.0) in 2023/4.
In contrast, there was no significant change between 2000 and 2023/4 in the overall proportion of adults aged 45 to 54, 55 to 64, and 65 to 74 drinking at hazardous levels or above. Data available for adults aged 75 and over indicates an increase in this group from 6.0% (CI 4.6, 7.7) in 2007 to 10.2% (CI 8.2, 12.6). A significant increase was also evident for female 55 to 64 year olds, in whom the proportion drinking at hazardous levels or above rose from 7.9% (CI 6.0, 10.3) in 2000 to 14.2% (CI 11.2, 17.8) in 2023/4.
Harmful levels or above
The proportion of 16 to 74 year olds drinking at harmful levels or above did not vary significantly over time. However, it should be noted that the confidence intervals around these estimates were wide.
For more information: Table 5.2 and Table B1 for confidence intervals
Variation in hazardous, harmful or dependent drinking by other characteristics
Ethnic group
In 2023/4, the age-standardised prevalence of drinking at hazardous levels or above (AUDIT 8+) varied between ethnic groups.
Prevalence ranged from 21.3% of White British (95% CI 19.7, 23.1) and 16.4% of Mixed/multiple/other (CI 9.3, 27.1) adults, to 5.8% of Black/Black British (CI 2.8, 11.9) and 4.3% of Asian/Asian British (CI 2.1, 8.4) adults. It should be noted that the confidence intervals for some estimates were wide and overlapping, so apparent differences between ethnic groups should be treated with caution.
For more information: Table 5.3 and Table A2 for confidence intervals
Employment status
In age-standardised analyses, there was no significant variation by employment status either in the proportion of working age adults with an AUDIT score of 8 or more, or the proportion with an AUDIT score of 16 or more.
For more information: Table 5.4
Problem debt
Problem debt was defined as being seriously behind with debt repayments or having utilities cut off. See the APMS 2023/4 Methods documentation for more information on how problem debt was derived. Age-standardised proportions of adults drinking at hazardous drinking levels and above (AUDIT 8+) by problem debt did not reach the required level of statistical significance.
The proportion of adults drinking at harmful levels and above (AUDIT 16+) was higher in adults with problem debt (5.8%) than those without problem debt (2.4%).
For more information: Table 5.5
Area-level deprivation
Comparisons between IMD quintiles are based on age-standardised estimates. Those living in the least deprived quintile (23.5%) were more likely to drink at hazardous levels and above (AUDIT 8+) than those in the fourth (13.9%) and fifth (16.5%) most deprived quintiles.
The age-standardised proportions of harmful drinking and above (AUDIT 16+) by area-level deprivation did not reach the required level of statistical significance.
For more information: Table 5.6
Region
In age-standardised analyses, the proportion of adults drinking at hazardous levels and above (AUDIT 8+) varied across regions. Those living in Yorkshire and the Humber were most likely to drink alcohol at hazardous levels or above (22.3%), and those living in the East of England were least likely (13.4%).
The proportion with harmful drinking and above (AUDIT 16+) did not vary significantly by region.
For more information: Table 5.7
Comorbidity
Physical health conditions
The age-standardised prevalence of drinking at hazardous levels and above (AUDIT 8+), or at harmful levels and above (AUDIT 16+), did not significantly vary by presence of a limiting physical health condition.
For more information: Table 5.8
Common mental health conditions
20.7% of adults with a common mental health condition (CMHC) drank at hazardous levels or above (AUDIT 8+), compared with 17.1% of those without a CMHC.
Adults with a CMHC were also more likely to drink at harmful levels or above (AUDIT 16+) (5.3%) than those who did not have a CMHC (2.0%). They were also more likely to meet the threshold for probable dependence (AUDIT 20+) (2.3%) than those who did not have a CMHC (0.6%).
For more information: Table 5.8
Self-diagnosis and professional diagnosis of alcohol dependence
Participants were shown a list of mental health conditions and asked whether they thought that they had ever had any of them. The list included ‘alcohol dependence’. Those who reported that they thought that they have been alcohol dependent were asked if this had been diagnosed by a professional, and if so, whether they had experienced alcohol dependence in the past 12 months.
Overall, 3.7% of adults said they felt they had been alcohol dependent at some point in their life. Men (5.2%) were twice as likely to report this as women (2.4%).
Among those with an AUDIT score indicative of harmful drinking (AUDIT 16-19) 29.3% believed that they have been alcohol dependent. Among those with an AUDIT score indicating probable alcohol dependence (AUDIT 20+), half (48.7%) believed that they have been alcohol dependent.
Participants who felt they had been alcohol dependent were asked whether they had been diagnosed with alcohol dependence by a doctor, psychiatrist or other professional. Overall, 1.2% of adults reported that they had been diagnosed as alcohol dependent. The prevalence was similar in men and women.
One in ten (9.9%) of those with an AUDIT score indicating harmful drinking and one in four (24.5%) of those with an AUDIT score indicating probable alcohol dependence (AUDIT 20+) reported that they had been diagnosed with alcohol dependence by a professional.
A small proportion (0.4%) of participants reported that they had been diagnosed with alcohol dependence and this condition had been present in the past 12 months. This included 7.3% of adults with harmful drinking levels (AUDIT 16-19) and 22.7% of adults with probable dependence (AUDIT 20+).
For more information: Table 5.9
Treatment
Treatment and service use for mental or emotional problems
Participants were asked about use of different types of mental health treatment and services. Two types of mental health treatment were asked about: current medication and psychological therapy for a mental or emotional problem. The use of a range of health, community and day care services over the past year were also asked about. This treatment and service use could have been for any mental health condition and was not necessarily related to their alcohol use.
Among adults with a harmful pattern of drinking (AUDIT 16-19), 26.1% were in receipt of treatment (23.7% received medication and 4.7% psychological therapy). Mental health treatment receipt was higher among adults with probable alcohol dependence (AUDIT 20+), among whom 55.9% received treatment for a mental or emotional problem (46.4% medication, 16.2% psychological therapy). 2.3% of those drinking at harmful levels and 6.6% of those with probable dependence received both medication and psychological therapy.
Health care service use for a mental health related reason was reported by 18.4% of adults drinking at harmful levels (AUDIT 16-19) and 38.8% of those with probable dependence (AUDIT 20+).
For more information: Table 5.10
Psychotropic medication
Participants were asked which psychotropic medications, used to treat mental health conditions, they take. These could have been for any mental health condition and were not necessarily related to their alcohol use. The most common medication types reported by all adults were those primarily used to treat depression (11.7%) and anxiety (10.7%). See Chapter 2 Mental health treatment and service use for more details.
- The most common medications taken by those drinking at harmful levels (AUDIT 16-19) were those used to treat depression (22.7%) or anxiety (22.1%). This group was about twice as likely as non-drinkers and low risk drinkers (AUDIT 0-7) to be taking medication used to treat depression (11.0%) and anxiety (10.0%).
- Adults with probable alcohol dependence (AUDIT 20+) were about four times more likely than non-drinkers and low risk drinkers to be taking depression (44.7%) or anxiety (43.3%) medication.
- 1.0% of adults drinking at harmful levels and 1.2% of those with probable dependence were taking medication for substance dependence, compared with 0.2% of non-drinkers and low risk drinkers.
For more information: Table 5.11
Treatment and support specifically for alcohol dependence
Participants who reported that they currently or used to drink alcohol were asked whether they had ever received a range of treatment and support services specifically related to drinking alcohol, including self-help advice or peer support, alcohol-related counselling or talking therapy, medication, detoxification or rehabilitation or other types of support.
About one in four (27.9%) adults drinking at harmful levels (AUDIT 16-19) and approaching one in two (43.3%) of those with probable dependence (AUDIT 20+) reported that they had received treatment or support specifically related to their drinking at some point in their life. Types of treatment and support used in relation to alcohol included:
- Advice or information, including self-help or peer support such as Alcoholics Anonymous (reported by 16.5% of those with harmful drinking; 30.6% with probable dependence)
- Counselling or talking therapy (10.9% of those with harmful drinking; 20.9% of those with probable dependence)
- Detoxication or rehabilitation (5.9% of those with harmful drinking; 13.4% of those with probable dependence)
- Medication (1.0% of those with harmful drinking; 4.8% of those with probable dependence).
For more information: Table 5.12
5.4 Discussion
Drinking at hazardous levels or above has fallen in prevalence in England from about one in four 16 to 74 year olds in 2000 to less than one in five in 2023/4. The decline was evident in both males and females and is broadly consistent with sources of data on trends in alcohol consumption. For example, the Health Survey for England (HSE) has shown a gradual decline in the maximum amount of alcohol consumed on any day in the past week (8 units for men, 6 units for women) between 2009 and 2019 (NHS Digital 2020).
Trends in drinking at hazardous levels or above differ markedly by age group. APMS finds that 16 to 24 year olds in 2023/4 were about half as likely as 16 to 24 year olds at the start of the century to drink at hazardous levels or above, with substantial declines also evident for 25 to 44 year olds. Research from the UK aiming to explain the decline in alcohol use in young people has proposed changing patterns in socialisation and increasing costs of alcohol as the key explanations (Whitaker et al. 2023). In contrast, no decline was evident among 45 to 74 year olds, and data for those aged 75 and older reveals significant increases since 2007. Notable rises since 2000 also emerged in the proportion of 55 to 64 year old women drinking at hazardous levels. It is likely that these trends reflect pronounced cohort effects consistent with evidence from across high-income countries indicating that alcohol use and related harms are increasing among older adults (Calvo et al. 2021). Birth cohort studies show that older cohorts have higher drinking participation than younger cohorts (Livingston et al. 2016), and alcohol-related hospitalisations and alcohol-induced deaths among Australians aged 50 and over have increased over the past two decades (Sutherland et al. 2024). Sutherland and colleagues described how higher rates of substance use among baby boomers, compared with earlier generations, have been documented. Alcohol has become 91% more affordable in the UK between 1989 and 2023 (NHS England 2024b), which may have impacted older adults’ spending on alcohol, with alcohol becoming more inexpensive over their lifetime (Crome and Rao 2018). While some posited that many would ‘mature out’ of such use, others hypothesised that as the baby boomer generation aged, elevated levels of alcohol use and related harms among older adults would be sustained (Patterson et al. 1999). This appears to have been borne out and raises concerns about the impact of this ageing demographic on health services, including harm reduction and substance use treatment services (Sutherland et al. 2024).
Despite falling rates overall, hazardous drinking remains common in England. Almost one in five adults drank at this level, one in twenty drank at harmful levels and one in a hundred were likely to be alcohol dependent, with rates higher in men than women. APMS results differ somewhat from HSE, which also used the AUDIT but with some differences in wording and method. It is also likely that both APMS and HSE, as household surveys, significantly underestimate prevalence, especially of the most harmful and dependent levels of drinking. Not only may these be underreported by participants due to stigma, but alcohol dependent adults may also be more likely to be homeless or in an institutional setting and therefore not included in the survey sample. Harmful or dependent drinkers living in private households may, like those with other substance dependence, be relatively less likely to respond to surveys, as they may be somewhat less available, able or willing to answer survey questions. There is also an issue due to the relatively small numbers of participants identified with harmful and dependent patterns of drinking. APMS 2023/4 had a particularly small number of young men in the sample, and the wide confidence intervals around estimates for this group should be noted.
There are pronounced subgroup variations in the prevalence of alcohol misuse, with prevalence highest among adults in White British and Mixed/multiple/other ethnic groups, and among those living in the North of England (especially in Yorkshire and the Humber). APMS findings were consistent with the alcohol harm paradox (Puddephatt et al. 2021): those living in the most deprived areas were less likely to drink alcohol at hazardous levels, and yet no less likely to have a harmful or dependent level of alcohol use. There is a need for prevention and support to address inequalities in harms.
Tailoring services and support to meet needs. APMS also confirms the strong co-occurrence of mental health and alcohol conditions, highlighting the need for mental health treatment and support services to recognize and respond to the treatment needs of people drinking at hazardous levels and above. Only a quarter of adults identified by the AUDIT with probable alcohol dependence reported that they had been diagnosed with alcohol dependence by a professional, and a small proportion (1.2%) were currently being prescribed medication for substance dependence. Less than half of those with probable dependence reported having ever received treatment or support specifically for their drinking, and this mostly comprised self-help or peer support. Overall these findings suggest that alcohol dependence may be both under-diagnosed and under-treated in England (Cheeta et al. 2008; Brown et al. 2015).
5.5 References
Awaworyi Churchill, S. and Farrell, L. (2017). Alcohol and depression: Evidence from the 2014 Health Survey for England. Drug and Alcohol Dependence, 180, 86-92.
Boniface, S., Kneale, J., & Shelton, N. (2014). Drinking pattern is more strongly associated with under-reporting of alcohol consumption than socio-demographic factors: evidence from a mixed-methods study. BMC Public Health, 14(1), 1297.
Brown, J., West, R., Angus, C., Beard, E., Brennan, A., Drummond, C., ... & Michie, S. (2015). Comparison of brief interventions in primary care on smoking and excessive alcohol consumption: a population survey in England. The British Journal of General Practice, 66(642), e1.
Calvo, E., Allel, K., Staudinger, U. M., Castillo‐Carniglia, A., Medina, J. T., & Keyes, K. M. (2021). Cross‐country differences in age trends in alcohol consumption among older adults: a cross‐sectional study of individuals aged 50 years and older in 22 countries. Addiction, 116(6), 1399-1412.
Cheeta, S., Drummond, C, Oyefeso, A., Phillips, T., Deluca, P., Perryman, K. & Coulton, S. (2008) Low identification of alcohol use disorders in general practice in England. Addiction, 103(5), 766-773.
Crome, I. and Rao, T. (2018). Our invisible addicts. Royal College of Psychiatrists. https://www.rcpsych.ac.uk/improving-care/campaigning-for-better-mental-health-policy/college-reports/2018-college-reports/our-invisible-addicts-2nd-edition-cr211-mar-2018
Cuijpers, P., Steunenberg, B., & van Straten, A. (2006). When children of problem drinkers grow old: does the increased risk of mental disorders persist?. Addictive Behaviors, 31(12), 2284-2291.
Department of Health. (2012). Improving Outcomes and Supporting Transparency. Part 1A: A Public Health Outcomes Framework for England, 2013–2016. https://www.gov.uk/government/publications/healthy-lives-healthy-people-improving-outcomes-and-supporting-transparency
Department of Health and Social Care. (2025). LAPE Statistical Tables for England 2025. https://fingertips.phe.org.uk/documents/LAPE_Statistical_Tables_ for_England_2025.xlsx
Department for Transport. (2024). Reported road casualties in Great Britain involving illegal alcohol levels: 2022. https://www.gov.uk/government/statistics/reported-road-casualties-in-great-britain-involving-illegal-alcohol-levels-2022/reported-road-casualties-in-great-britain-involving-illegal-alcohol-levels-2022
Drummond, DC., Oyefeso, N., Phillips, T., Cheeta, S., DeLuca, P., et al. (2008). The prevalence of mental disorders among the homeless in western countries: systematic review and meta-regression analysis. PLoS Medicine, 5(12): e225.
Forouzanfar, M. H., Afshin, A., Alexander, L. T., Anderson, H. R., Bhutta, Z. A., Biryukov, S., ... & Carrero, J. J. (2016). Global, regional, and national comparative risk assessment of 79 behavioural, environmental and occupational, and metabolic risks or clusters of risks, 1990–2015: a systematic analysis for the Global Burden of Disease Study 2015. The Lancet, 388(10053), 1659-1724.
GBD 2016 Alcohol Collaborators. (2018). Alcohol use and burden for 195 countries and territories, 1990–2016: a systematic analysis for the Global Burden of Disease Study 2016. The Lancet, 392(10152), 1015.
Grant, B. F., Stinson, F. S., Dawson, D. A., Chou, S. P., Dufour, M. C., Compton, W., ... & Kaplan, K. (2004). Prevalence and co-occurrence of substance use disorders and independent mood and anxiety disorders: Results from the national epidemiologic survey on alcohol and related conditions. Archives of General Psychiatry, 61(8), 807-816.
HM Government. (2021). From harm to hope: A 10-year drugs plan to cut crime and save lives. https://www.gov.uk/government/publications/from-harm-to-hope-a-10-year-drugs-plan-to-cut-crime-and-save-lives
Institute of Alcohol Studies (IAS). (2024). The costs of alcohol to society. https://www.ias.org.uk/report/the-costs-of-alcohol-to-society/
Light, M., Grant, E., Hopkins, K. (2013). Gender differences in substance misuse and mental health amongst prisoners. https://assets.publishing.service.gov.uk/media/5a7ccb2940f0b65b3de0b33c/gender-substance-misuse-mental-health-prisoners.pdf
Livingston, M., Raninen, J., Slade, T., Swift, W., Lloyd, B., & Dietze, P. (2016). Understanding trends in Australian alcohol consumption—an age–period–cohort model. Addiction, 111(9), 1590-1598.
McManus, S., Bebbington, P., Jenkins, R., Brugha, T. (eds). (2016). Adult Psychiatric Morbidity Survey 2014. Leeds: NHS Digital. https://digital.nhs.uk/data-and-information/publications/statistical/adult-psychiatric-morbidity-survey/adult-psychiatric-morbidity-survey-survey-of-mental-health-and-wellbeing-england-2014
National Institute for Health and Care Excellence. (2011). Alcohol-use disorders: diagnosis, assessment and management of harmful drinking (high-risk drinking) and alcohol dependence. Clinical guideline [CG115]. (Updated 2014). https://www.nice.org.uk/guidance/cg115
NHS Digital. (2020). Health Survey for England, 2019. https://digital.nhs.uk/data-and-information/publications/statistical/health-survey-for-england/2019
NHS England. (2024a). Health Survey for England, 2022 Part 1. https://digital.nhs.uk/data-and-information/publications/statistical/health-survey-for-england/2022-part-1
NHS England. (2024b). Statistics on Public Health, England 2023. https://digital.nhs.uk/data-and-information/publications/statistical/statistics-on-public-health/2023
Office for Health Improvement and Disparities. (2023). UK clinical guidelines for alcohol treatment: core elements of alcohol treatment. Closed consultation. https://www.gov.uk/government/consultations/uk-clinical-guidelines-for-alcohol-treatment/uk-clinical-guidelines-for-alcohol-treatment-core-elements-of-alcohol-treatment#identification-and-brief-interventions
Office for Health Improvement and Disparities. (2024). Alcohol profile: short statistical commentary, December 2024. https://www.gov.uk/government/statistics/alcohol-profiles-for-england-december-2024-update/alcohol-profiles-for-england-short-statistical-commentary-december-2024
Office for National Statistics. (2025). Nature of crime: violence. https://www.ons.gov.uk/peoplepopulationandcommunity/ crimeandjustice/datasets/natureofcrimetablesviolence
Patterson, T. L., & Jeste, D. V. (1999). The potential impact of the baby-boom generation on substance abuse among elderly persons. Psychiatric Services, 50(9), 1184-1188.
Puddephatt, J. A., Jones, A., Gage, S. H., Fear, N. T., Field, M., McManus, S., ... & Goodwin, L. (2021). Associations of alcohol use, mental health and socioeconomic status in England: findings from a representative population survey. Drug and Alcohol Dependence, 219, 108463.
Puddephatt, J. A., Makin, H., Gage, S. H., Jones, A., & Goodwin, L. (2023). Understanding alcohol use and changes in drinking habits among people with a severe mental illness: a qualitative framework analysis study. Frontiers in Psychology, 14, 1282086.
Roberts, E., Hotopf, M., & Drummond, C. (2020). The relationship between alcohol-related hospital admission and specialist alcohol treatment provision across local authorities in England since passage of the Health and Social Care Act 2012. The British Journal of Psychiatry, 218(4), 230-232.
Rumgay, H., Shield, K., Charvat, H., Ferrari, P., Sornpaisarn, B., Obot, I., ... & Soerjomataram, I. (2021). Global burden of cancer in 2020 attributable to alcohol consumption: a population-based study. The Lancet Oncology, 22(8), 1071-1080.
Saunders, J. B., Aasland, O. G., Babor, T. F., De la Fuente, J. R., & Grant, M. (1993). Development of the alcohol use disorders identification test (AUDIT): WHO collaborative project on early detection of persons with harmful alcohol consumption‐II. Addiction, 88(6), 791-804.
Sutherland, R., Gisev, N., & Larney, S. (2024). Trends in substance use and related harms among older adults in high‐income countries. Addiction, 119(10), 1676-1678.
Weich, S., McBride, O., Hussey, D., Exeter, D., Brugha, T., & McManus, S. (2011). Latent class analysis of co-morbidity in the Adult Psychiatric Morbidity Survey in England 2007: implications for DSM-5 and ICD-11. Psychological Medicine, 41(10), 2201-2212.
Whitaker, V., Curtis, P., Fairbrother, H., Oldham, M., & Holmes, J. (2023). Young people’s explanations for the decline in youth drinking in England. BMC Public Health, 23(1), 402.
World Health Organization. (1993). The ICD-10 classification of mental and behavioural disorders. World Health Organization.
World Health Organization. (2019). International Classification of Diseases 11th Revision (ICD-11). https://icd.who.int/en/
World Health Organization. (2024). Alcohol. https://www.who.int/news-room/fact-sheets/detail/alcohol
5.6 Citation
Please cite this chapter as:
Young, E., Randall, E., Hill, S., Morris, S., Drummond, C., Fear, N., Goodwin, L., McBride, O., & McManus, S. Alcohol dependence. (2025) In Morris, S., Hill, S., Brugha, T., McManus, S. (Eds.), Adult Psychiatric Morbidity Survey: Survey of Mental Health and Wellbeing, England, 2023/4. NHS England.
Last edited: 8 December 2025 3:02 pm