Publication, Part of National Diabetes Audit, Type 1 Diabetes
National Diabetes Audit, 2020-21, Type 1 Diabetes
Future publication format
Please note that future publications will be web-based only. This is to improve the accessibility of our publications
16 June 2022 09:30 AM
Treatment targets
How many adults with type 1 diabetes met their recommended treatment targets?
HbA1c achievement – Time series
Table 3: Adults with type 1 diabetes*, by HbA1c result (mmol/mol)**, England and Wales, 2017-18 to 2020-21.
| Audit period | Total | HbA1c ≤ 48 | 48 < HbA1c ≤ 53 | 53 < HbA1c ≤ 58 | 58 < HbA1c ≤ 70*** | 70*** < HbA1c ≤ 86 | HbA1c > 86 | HbA1c Unknown | |||||||
| Number | Number | Per cent | Number | Per cent | Number | Per cent | Number | Per cent | Number | Per cent | Number | Per cent | Number | Per cent | |
| 2020-21 | 175,395 | 17,170 | 9.8 | 16,990 | 9.7 | 22,490 | 12.8 | 49,130 | 28.0 | 43,480 | 24.8 | 25,260 | 14.4 | 875 | 0.5 |
| 2019-20 | 192,320 | 15,630 | 8.1 | 16,175 | 8.4 | 22,940 | 11.9 | 58,395 | 30.4 | 48,140 | 25.0 | 30,495 | 15.9 | 545 | 0.3 |
| 2018-19 | 194,715 | 16,160 | 8.3 | 16,195 | 8.3 | 23,110 | 11.9 | 59,265 | 30.4 | 48,655 | 25.0 | 30,735 | 15.8 | 600 | 0.3 |
| 2017-18 | 193,235 | 15,710 | 8.1 | 16,030 | 8.3 | 22,730 | 11.8 | 59,025 | 30.5 | 48,375 | 25.0 | 30,745 | 15.9 | 615 | 0.3 |
* In 2020-21, severely frail adults are excluded
** Only includes adults who had a recorded HbA1c check within the audit period.
*** 58<HbA1c<=69 and 69<HbA1c<=86 in 2020-21
In 2020-21:
- 9.8% achieved the NICE HbA1c target of 48 mmol/mol or lower*.
- Almost 1 in 5 had an HbA1c result of 53 mmol/ml or lower (19.5%), and 32.3% achieved the HbA1c treatment target of 58 mmol/mol or lower.
- 14.4% had a very high risk HbA1c result of above 86 mmol/mol in 2020-21, compared to 15.9% in 2019-20
* NICE Guideline 17.1.6: https://www.nice.org.uk/guidance/ng17/chapter/Recommendations
HbA1c treatment target – CCG/LHB variation in proportion meeting treatment target (HbA1c ≤ 58 mmol/mol, 7.5%)
- Of 113 CCG/LHBs, 50 were more than 2 SD beyond the expected number of adults achieving the treatment target
- 19 CCG/LHBs were above expectation
- 31 CCG/LHBs were below expectation
- Sex
- Age group
- Duration of diabetes
- Ethnicity
- Deprivation quintile
- BMI group
- Smoking status
- Insulin regimen
- CGM status
- Frailty status
HbA1c – contributing factors (HbA1c ≤ 58mmol/mol)
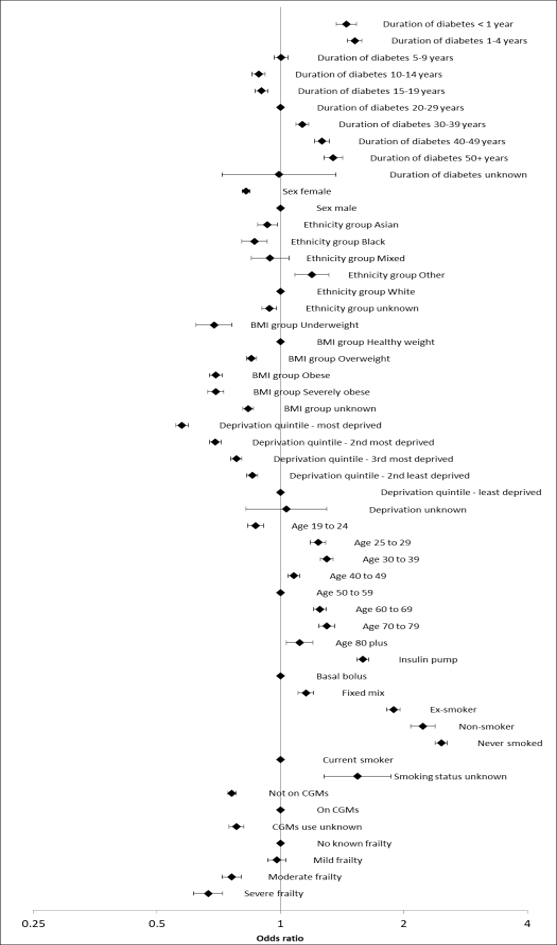
Figure 11 shows a forest plot of odds ratios which illustrate the individual person characteristics associated with adults meeting the HbA1c ≤ 58mmol/mol treatment target. These odds ratios were derived from a logistic regression model*.
Figure 11: Individual person characteristics in adults with type 1 diabetes and likelihood of meeting the HbA1c ≤ 58 mmol/mol treatment target , England and Wales, 2020-21
* For explanations of odds ratios, logistic regression and forest plot interpretation please see Additional Information: ‘Definitions – Statistical terms’.
HbA1c treatment target – CCG/LHB variation in proportion meeting treatment target (HbA1c ≤ 86 mmol/mol, 10%)
- Of 113 CCG/LHBs, only 3 were more than 2 SD beyond the expected number of adults achieving the treatment target, and none were outside of 3 SD.
- 1 CCG/LHB was above expectation.
- 2 CCG/LHBs were below expectation
- Sex
- Age group
- Duration of diabetes
- Ethnicity
- Deprivation quintile
- BMI group
- Smoking status
- Insulin regimen
- CGM status
- Frailty status
HbA1c – contributing factors (HbA1c ≤ 86mmol/mol)
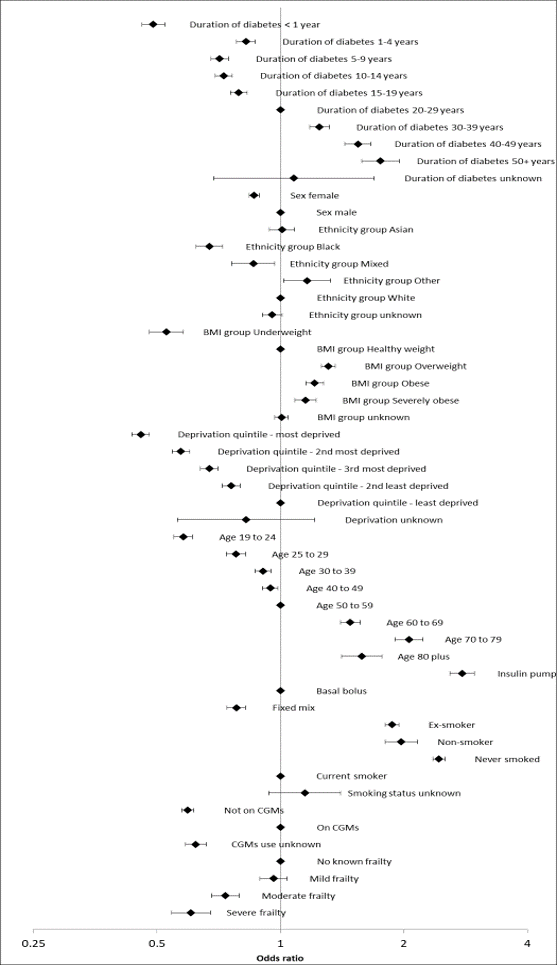
Figure 13 shows a forest plot of odds ratios which illustrate the individual person characteristics associated with an HbA1c value up to 86 mmol/mol. These odds ratios were derived from a logistic regression model*.
Figure 13: Individual person characteristics in adults with type 1 diabetes and likelihood of HbA1c up to 86mmol/mol, England and Wales, 2020-21
* For explanations of odds ratios, logistic regression and forest plot interpretation please see Additional Information: ‘Definitions – Statistical terms’.
Treatment target – CCG/LHB
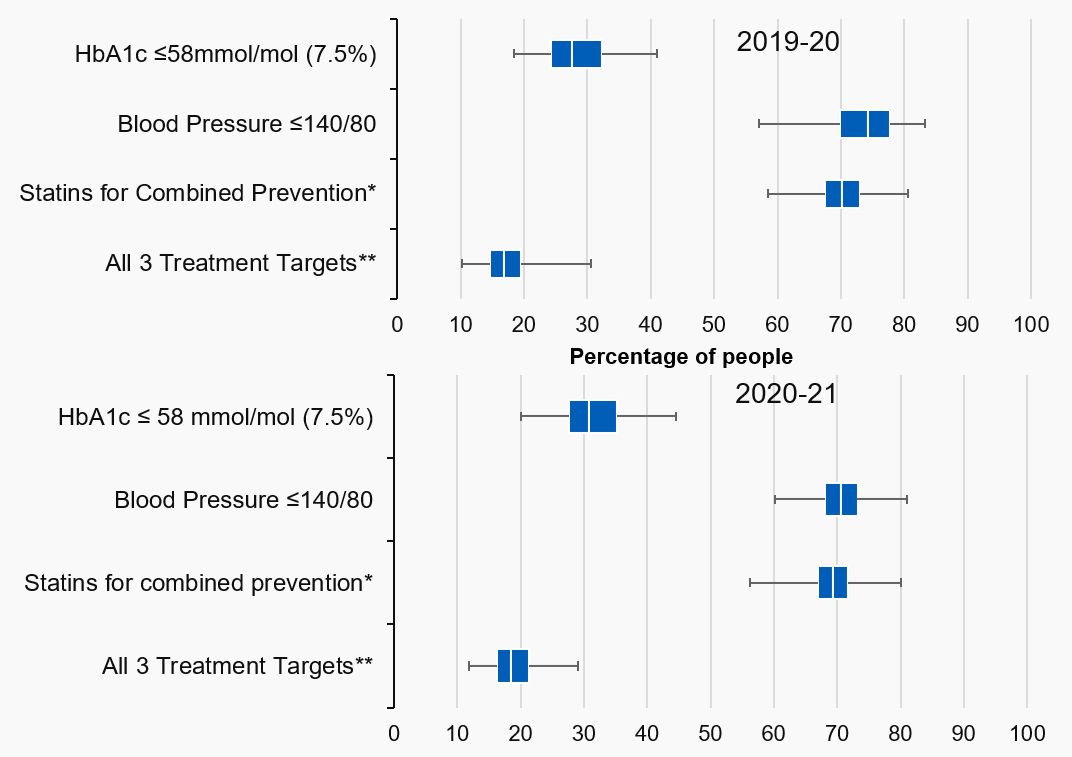
Figure 14: The range of CCG/LHB treatment target achievement*,** for adults with type 1 diabetes, England and Wales, 2019-20 and 2020-21***
-
 This an image of a box and whisker plot showing the variation in achievement of the three treatment targets and "All 3 treatment targets". It shows the median, interquartile range and range of the achievement percentages across all CCG/LHBs.
* Achievement rates of statins for Primary, Secondary and Combined Prevention only include people eligible for statins in calculation.
** Defined as having HbA1c ≤58mmol/mol, blood pressure ≤140/80 and for people falling in the combined prevention CVD group: receiving statins.
*** 2020-21 achievement only calculated for adults who were not severely frail
- The rates of treatment target achievement did not all change in the same direction between 2019-20 and 2020-21
- The median rate of achieving HbA1c ≤ 58mmol/mol (7.5%) increased from 27.6% in 2019-20 to 30.8% in 2020-21
Last edited: 3 October 2024 8:13 am